Vetting new vendors for cyber risk and working with existing vendors to improve their security practices can be a tall order for any third-party risk management (TPRM) program. But it can be near impossible without the right data feeding TPRM decision-making.
TPRM managers need a continuously updated collection of high-fidelity data about vendors' risk factors to put together an accurate and timely picture of their third-party cyber risk posture. This picture is what drives decisions about how (and whether) to structure relationships with vendors.
Most risk management veterans understand this principle instinctively. But just as they would never make a risk decision purely on instinct, we don't want to make any assumptions on how much and which data can best predict vendor risk without studying some statistics.
This is why RiskRecon recently engaged the data scientists with Cyentia Institute to put some numbers to which data sets available to TPRM managers do the best job of modeling third-party risk. In the report From Uncertainty to Understanding, they found that certain types of data definitely outperform others in predicting cyber risk posture at third parties. We can see that in the following distribution chart from the report, which graphs the relative importance of several dozen publicly observable factors:
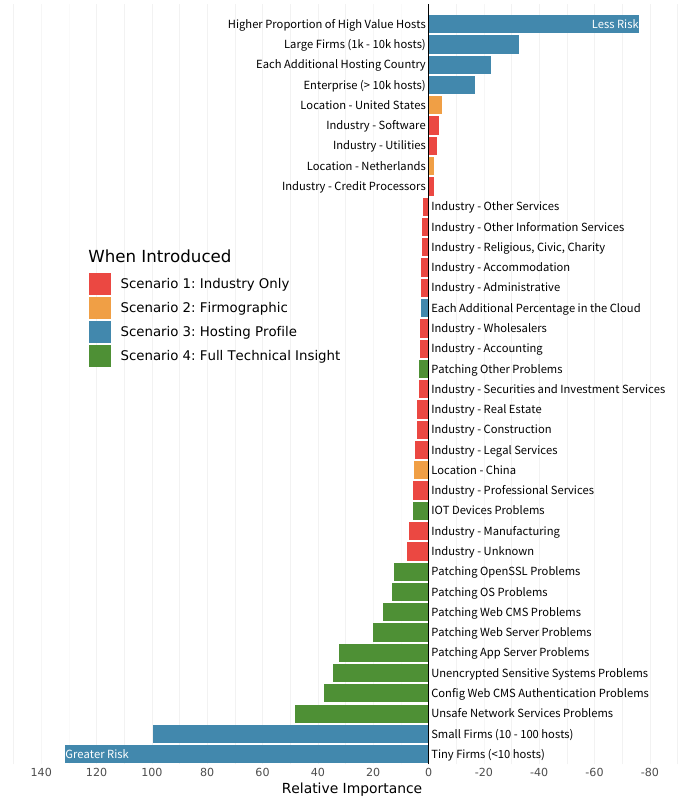
The analysis by Cyentia found that in the risk prediction model including all of these factors, the ones with the longest length bars contribute most accurately toward predicting risk posture. For example, among the green bars that represent data about security findings assessed at vendors, exposing unsafe network services proved to be the strongest single predictor of risk posture.
But here's the interesting tidbit from that chart. What trumps everything is that that these data streams are observed in the context of one another.
You'll notice that the chart shows that the categories involving the number of hosts are most strongly correlated to accurate risk predictions. However, the report also found that when a different risk model only looked at the number of hosts and did not observe security findings, then this data held far less explanatory power.
In a risk model that only looked at the number of hosts, as well as some basic firmographics like industry and geography, that data was only able to explain just 5.2% of variation in risk among individual third parties. That's in stark contrast to the more complete model represented in the above chart, which includes full technical analysis of security findings. This more robust model explains 61.4% of variation in risk among individual vendors—a whopping eleven-fold increase in explanatory power over infrastructure size alone.
Risk factors don't exist on an island, so it only follows that in third-party risk modeling context is absolutely crucial. In this example, just looking at an infrastructure's footprint can't offer risk managers that much insight into how many issues exist in that infrastructure. But once you layer in proper assessment of security-related issues, organization size can become a major predictor of a vendor's ability to address those issues. Smaller firms tend to struggle to fix issues, whereas larger enterprises with more hosts are able to more quickly mitigate the ones most likely to jeopardize the vendor's—and your—risk posture.
To read more details of how Cyentia experts crunched the numbers, check out the full report here.