In October 2020, we will be releasing an update to our cybersecurity risk rating model founded on our platform's unique ability to automatically assess cybersecurity risk performance. As we continue our blog series discussing this upcoming ratings model release, this post will dive into the background around the updated cybersecurity risk ratings model.
RiskRecon rates the quality of enterprise cybersecurity risk performance based on continuous collection and analytics of open-source intelligence signals that determine the rates and severities of cybersecurity issues within the context of the value at risk of the systems in which the issues exist. RiskRecon’s risk assessment scope spans nine security domains built on approximately 40 criteria which assess systems against thousands of security tests.
|
Grade |
Rating Range |
|
A |
8.5 – 10 |
|
B |
7.0 – 8.4 |
|
C |
5.5 – 6.9 |
|
D |
4.0 – 5.4 |
|
F |
0.0 – 3.9 |
Rating Scale
RiskRecon rates cybersecurity risk performance on a scale of 0.0 – 10, with 10 being the best rating. RiskRecon overlays an A - F grading scale on top of the numeric ratings that separates performance into five bands. RiskRecon selected the five-tier grading system for two reasons. First, the A – F grading system is internationally familiar, with Wikipedia showing that at least 37 countries use the system for grading student performance. This aids consumers of the ratings in quickly understanding their own performance in relation to other companies. Second, five tiers provide useful portfolio-level performance segmentation, making it easier for analysts to identify and act on portfolio risk hot spots.
Ratings Distribution
Across the 46,000 companies monitored by RiskRecon, the average rating is 7.3 – a solid B. RiskRecon intentionally set the rating ranges for each tier to force a planned distribution of companies to aid in ranking company performance and setting assessment priorities.
Portfolio-Specific Rating Distributions
The distribution of company risk performance varies based on the population of the portfolio being analyzed. The table below shows the rating distributions for two actual RiskRecon customer portfolios along with an example RiskRecon portfolio containing 46,000 companies.
|
|
RiskRecon Modeling Portfolio (46,000) |
Credit Rating Company Vendor Portfolio (1,100) |
Pharmaceutical Company Vendor Portfolio (5,200) |
|
A |
22% |
18% |
12% |
|
B |
40% |
41% |
38% |
|
C |
26% |
31% |
33% |
|
D |
9% |
8% |
12% |
|
F |
3% |
2% |
5% |
Industry Rating Distributions
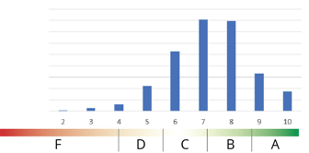
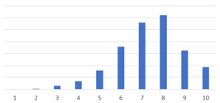
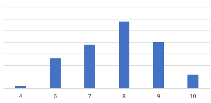
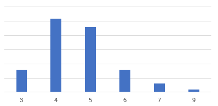
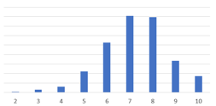
Segmenting portfolios by industry reveals starkly different cybersecurity risk performance ratings and distributions. The banking industry has an industry average of 7.8 (a solid “B”) with a very narrow variance, having almost no companies rating below a “C”. In comparison, the healthcare industry has an average rating of a 7.2 with a much wider variance. Universities take up the tail end with a very low average rating of 4.5 (“D”) with almost no organizations performing above a “C”.
|
Rating Tier |
All Companies |
Banking |
Universities |
Healthcare |
|
A |
22% |
30% |
0% |
17% |
|
B |
40% |
45% |
1% |
41% |
|
C |
26% |
25% |
16% |
31% |
|
D |
9% |
0% |
57% |
9% |
|
F |
3% |
1% |
26% |
2% |
|
Avg. Rating |
7.3 |
7.8 |
4.5 |
7.2 |
|
Variation |
2.4 |
1.3 |
1.7 |
2.0 |
The graphs below visualize the ratings distribution for these three industries compared to all companies.
|
All Companies
|
Banking Industry
|
|
Universities
|
Healthcare Industry
|
You may download the full white paper here or feel free to request a product demonstration to gain a deeper understanding of how the new risk rating model can help you understand and act on third-party cyber risks.