In this blog, we wrap up our series on IoT device findings. We invite you to download the full study here!
As we’ve seen in several recent reports, the presence of one type of finding can be a harbinger of a wider range of security problems. This “where there’s smoke, there’s fire” principle is an important one for organizations looking to efficiently manage the overwhelming volume of issues clamoring for remedial attention. First, let’s simply look at the density of findings, which measures the number of all security issues identified per host for each organization.
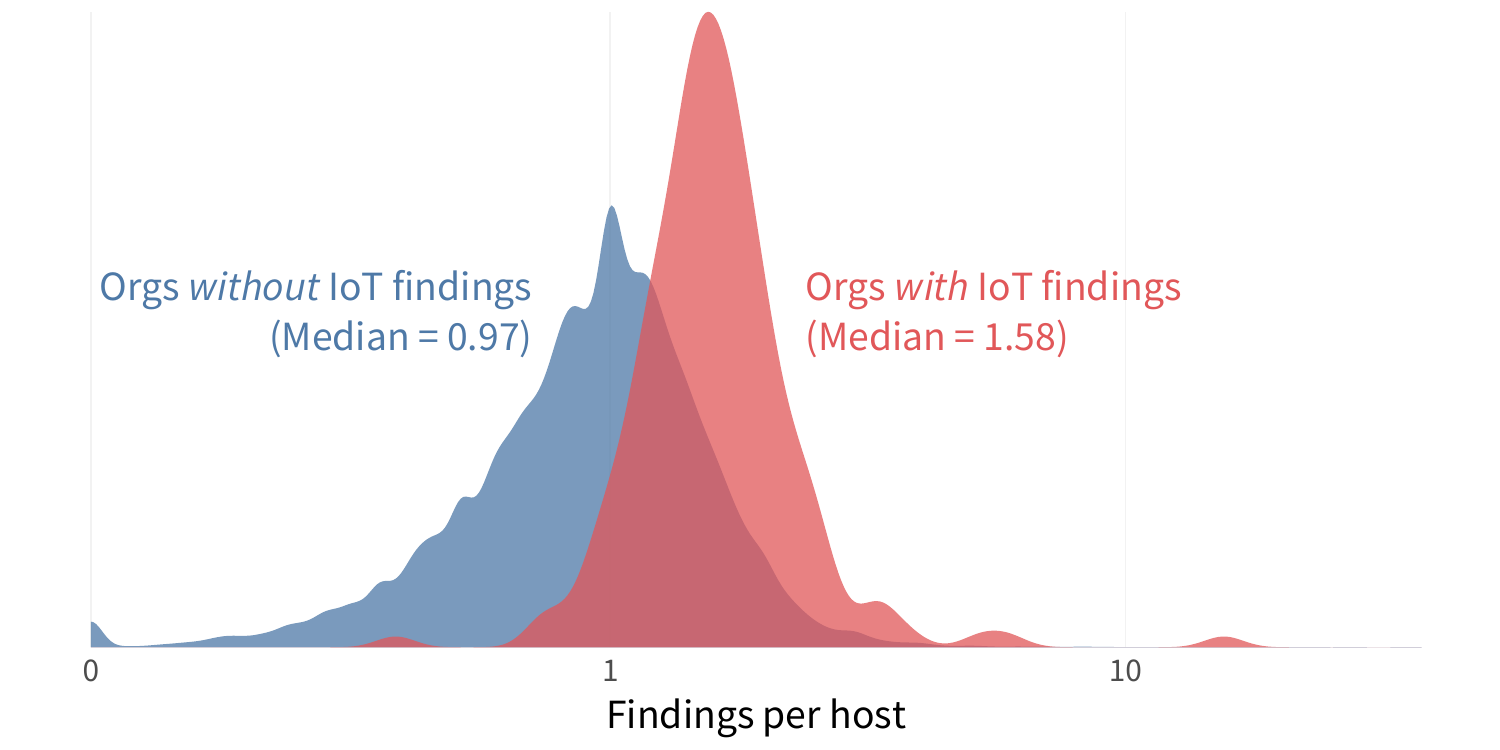
The figure below shows the density for organizations that have IoT devices and those that don’t. The takeaway is that organizations with exposed IoT devices have 62% higher flaw density than those that don’t. Thus, exposed enterprise IoT devices are a clear tip-off that other security issues exist across the organization’s infrastructure.
FIGURE 1: NUMBER OF SECURITY FINDINGS AMONG FIRMS WITH (RED) AND WITHOUT (BLUE) EXPOSED IOT DEVICES
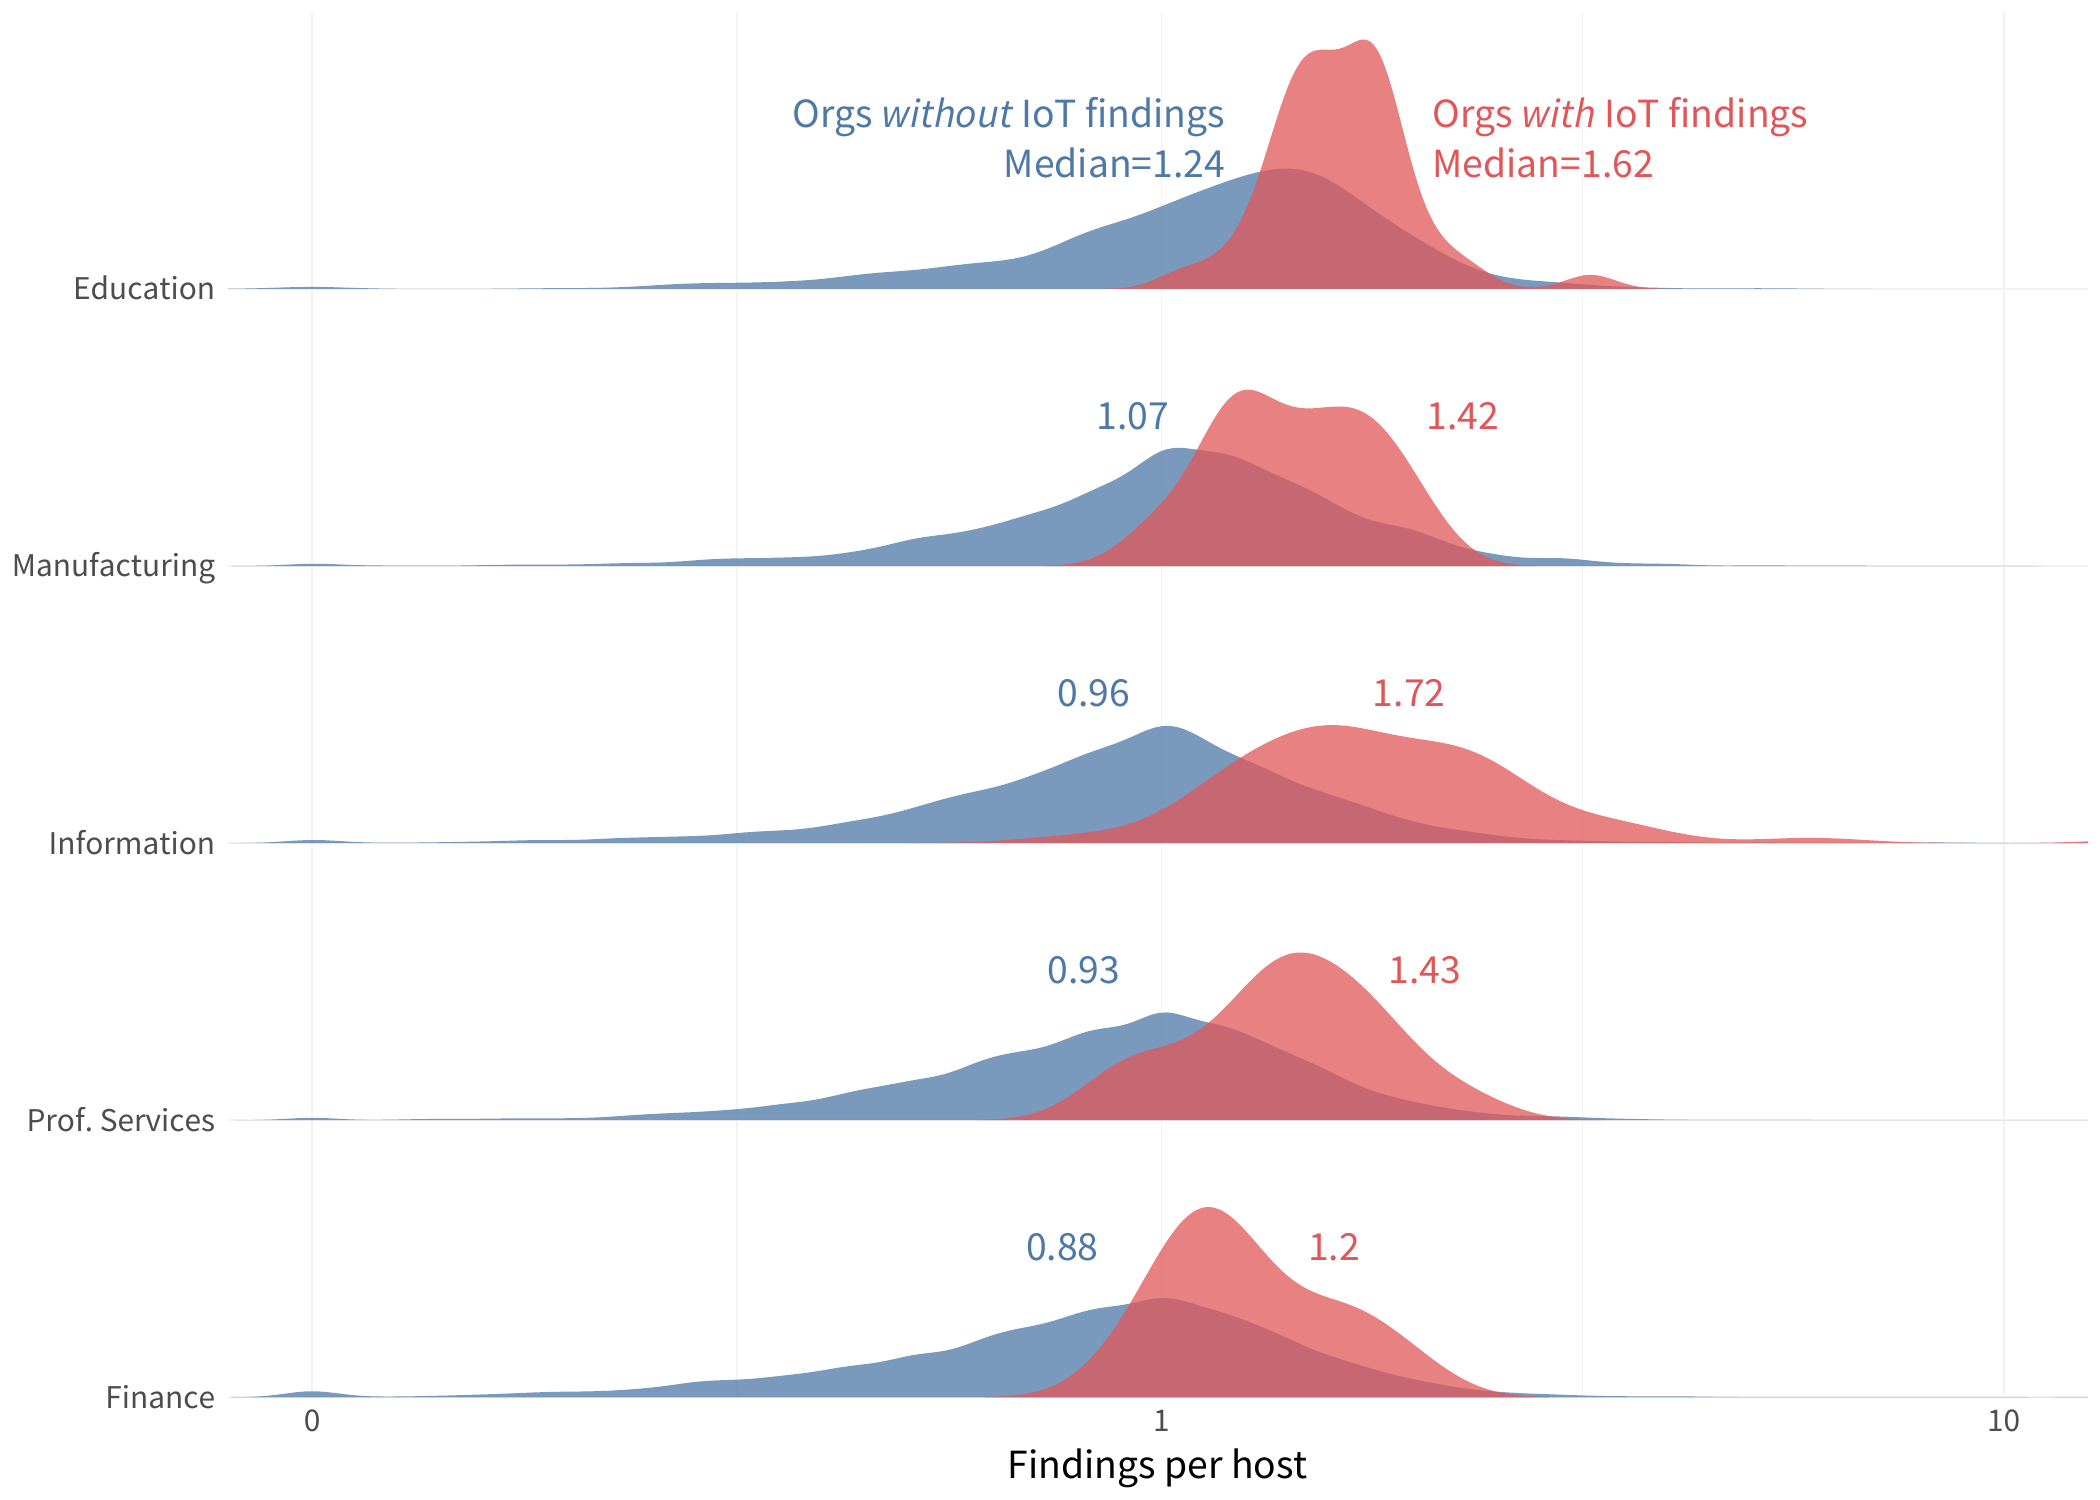
 Furthermore, we find this ‘IoT as a smoke signal’ principle to be true across various industries. Again, Education leads the pack in finding density but also shows a significant difference between institutions with and without exposed IoT devices. Interestingly, the Information sector has the biggest gap between the IoT haves and have-nots. Those with IoT devices exposed have nearly 80% higher median density of security findings. That suggests it’s even more important to know what your partners in that sector (which includes providers of various types of IT services) are exposing to the internet.
FIGURE 2: FINDINGS DENSITY AMONG FIRMS WITH (RED) AND WITHOUT (BLUE) EXPOSED IOT DEVICES BY INDUSTRY
We now know that organizations with IoT devices exposed tend to also have a higher density of other security findings. But what types of findings are more likely for those organizations? Glad you asked.
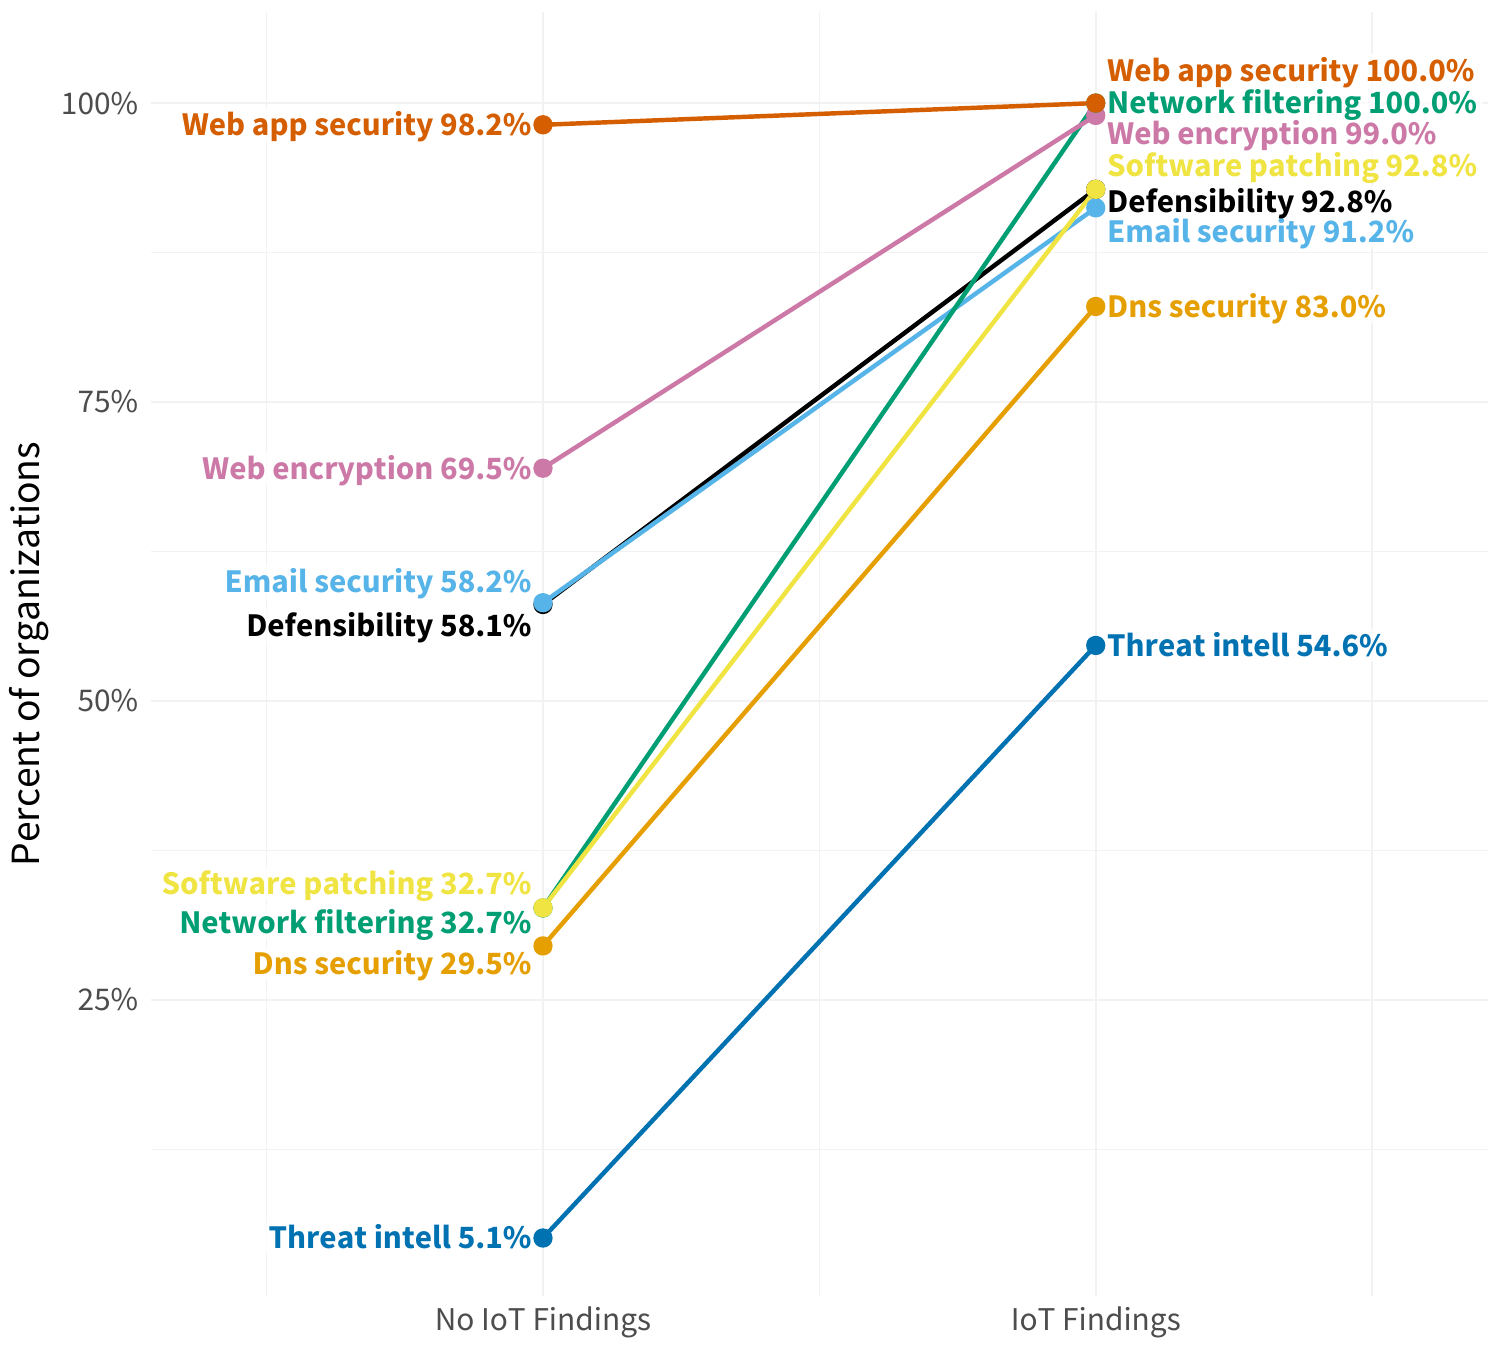
In Figure 3, we see an increase across the board for all types of findings among firms that have exposed IoT devices. Issues associated with network filtering and software patching increase the most, but most categories jump 30% to 60% in prevalence. This also nearly guarantees (>90%) that firms will exhibit every type of finding other than those falling under DNS security or threat intelligence.
FIGURE 3: INCREASE IN TYPES OF SECURITY FINDINGS AMONG ORGANIZATIONS EXPOSING IOT DEVICES
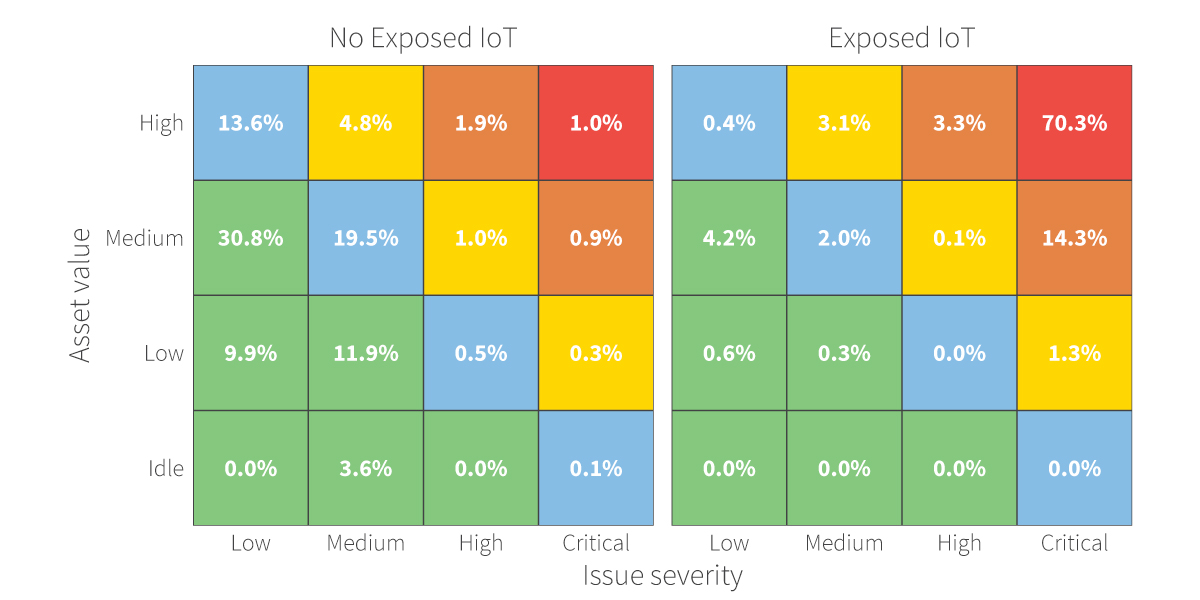
We’d be remiss if we didn’t leave you with a view of how this looks through RiskRecon’s risk priority matrices. As you can see, exposed IoT devices sit almost exclusively in the top right corner of the matrix where the dangerous combo of high-value assets and critical security findings collide.
FIGURE 4: RISK PRIORITY MATRICES FOR ORGANIZATIONS WITH (RIGHT) AND WITHOUT (LEFT) EXPOSED IOT DEVICES
Wondering how RiskRecon can help your organization take action on the findings from this report? Reach out now and learn how you can get full visibility into your firms' cyber risk.