As we continue to explore the key findings from our latest research report, Third-Party Security Signals, this blog will dive into the correlation of firms with unsafe services exposed to the internet to having more serious cybersecurity threats - and more importantly, how organizations are vulnerable to third-party cyber risk issues.
Overall, the ease with which attackers can find and exploit unsafe services at scale across the Internet suggests that organizations should be more concerned with the consequences of unnecessarily exposing services versus the number or fraction of exposed hosts. This section seeks to explore whether such services correlate with unsound security practices more generally. For instance, are the firms that expose Telnet to the internet also likely to store sensitive data in the clear or allow simple authentication practices? In other words, if an organization exposes many of these services to the internet, do they also exhibit more critical security findings?
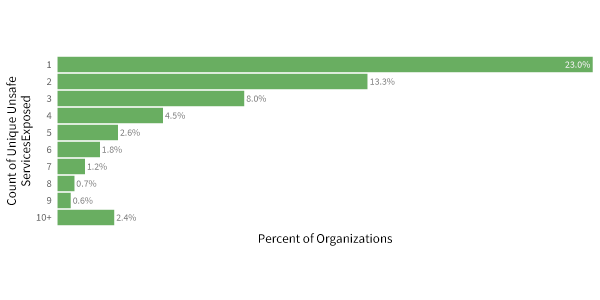
To answer that, let’s get a quick look at how many unsafe services firms typically expose. Doing so narrows our sample to organizations with more than 100 Internet-facing hosts. What we see in the figure below that 23% of firms expose one service, 13% expose two services, and just under 10% of organizations exposing five or more services. Interesting data, you say, but does that matter? The next graphic in this blog says yes.
The graphic below acts as the “So What?” of the figure above. The green dots in the graphic represent organizations, and their position along the horizontal axis shows the percent of their external hosts that exhibit high or critical security findings. The clusters of green dots show wide variation. Some organizations that expose few unsafe services have a higher density of security findings than those exposing many and vice versa. From this view, it’s difficult to discern any concrete pattern or story.
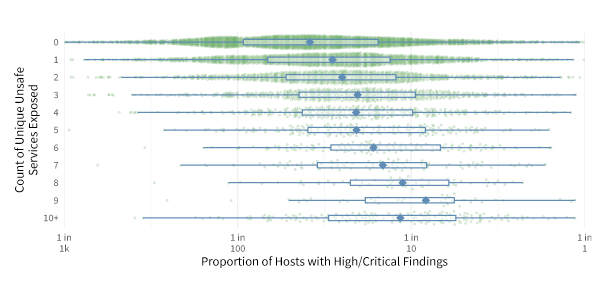
The green dots in the graphic show the percent of each firm’s external hosts that exhibit high or critical security findings. The blue dots mark the average for each group, making it clear that the rate of severe security problems increases consistently with the number of unsafe services.
However, the blue boxplots and dots provide a better big-picture statistical view of what’s happening. Here we clearly see that the average rate (blue dot) of findings increases consistently with the number of unsafe services. A typical firm exposing zero unsafe services to the Internet has about 1 high or critical security issue for every 38 hosts (2.6%). Comparatively, a firm running nine of such services exhibits a findings density that’s nearly 5x higher (1 in 8 hosts, or 12%)! This is yet another example of the strong correlation between hygiene and health (or practice and posture, if you prefer) in cybersecurity.
What’s Most Indicative of Insecurity?
As you might suspect, some of these unsafe services are better indicators of broader security problems than others. The chart below presents the details. The vertical line marks the base rate for severe security findings among organizations at about 1 in 36 hosts (2.8%). The blue lines indicate the change in that baseline rate when a firm runs any of the unsafe services listed on the left. Thus, ElasticSearch and MongoDB appear to be the biggest canaries in the coal mine. Organizations that expose those services to the Internet have a rate of severe findings that’s 4x to 5x higher than the baseline!
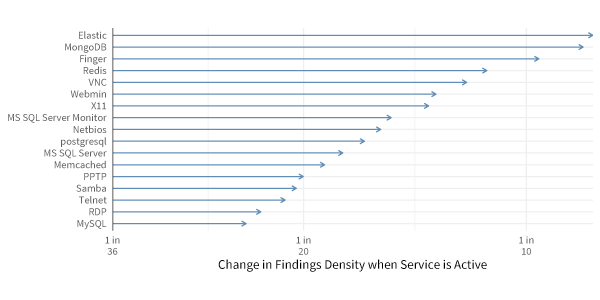 The arrows in this chart indicate the change in the baseline findings density (1 in 36 hosts) when organizations run the unsafe services listed on the left. For instance, firms that expose ElasticSearch and MongoDB have 4x to 5x higher the rate of severe security findings than those that do not run those services on Internet-facing hosts.
Our research indicated that MySQL was found to be the most prevalent exposed service by a wide margin. However, MySQL is the least of all evils listed in the chart above in terms of presaging additional security issues. Similar things can be said of PPTP, Telnet, and RDP, which all fall near the bottom of the chart. But don’t interpret that as a green light to spin up those services willy nilly; all of them indicate a significantly higher propensity for security problems. But this chart does offer a reasonable prioritization mechanism if you’re looking for a place to start in tidying up your Internet footprint. Take our word for it—none of these will spark joy.
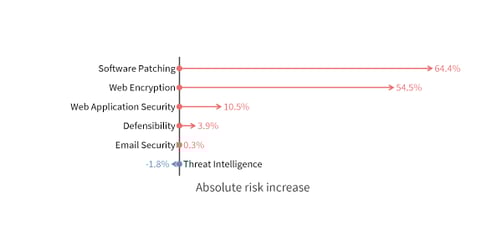
Now that we know which unsafe services correlate most strongly with other organizational security findings, let’s see what types of findings that entails. This last graphic makes it clear that failing to patch software is the most prevalent security finding associated with unsafe services. Read the chart like this: 64% of hosts that run unsafe services are also missing important patches. Co-occurring issues with web encryption are a close second. The point here isn’t that unsafe services cause patching, encryption, or other problems, but rather lax security practices tend to occur in droves. And that’s why paying attention to smoke signals like these services can be a warning of yet unseen fires endangering your organization and its third parties.
 Download the new report, Third-Party Security Signals: Exposing the reality of unsafe network services, to read the full findings from this exclusive research study and find out how you can apply the findings to your third-party risk management program.