Recently, RiskRecon and the Cyentia Institute launched a research report called, The State of Noncompliance in Cyber Risk, which aimed to understand which regulations related to third-party risk management are the toughest for firms to meet, and what parts of these standards are causing the most issues as seen by the RiskRecon platform. During a blog series that will be published out over the next few weeks, we will examine the details and points from that report, breaking things down in bite sized pieces.
One of the main themes that immediately surfaces from the available data in our report, is that nearly every organization struggles with at least some degree of noncompliance.
The global data in the chart below shows that between 99.4% to 100% (yes, virtually every one) of the tested organizations have at least one finding that puts their assets at risk of noncompliance across eight of the nine tested regulatory frameworks.
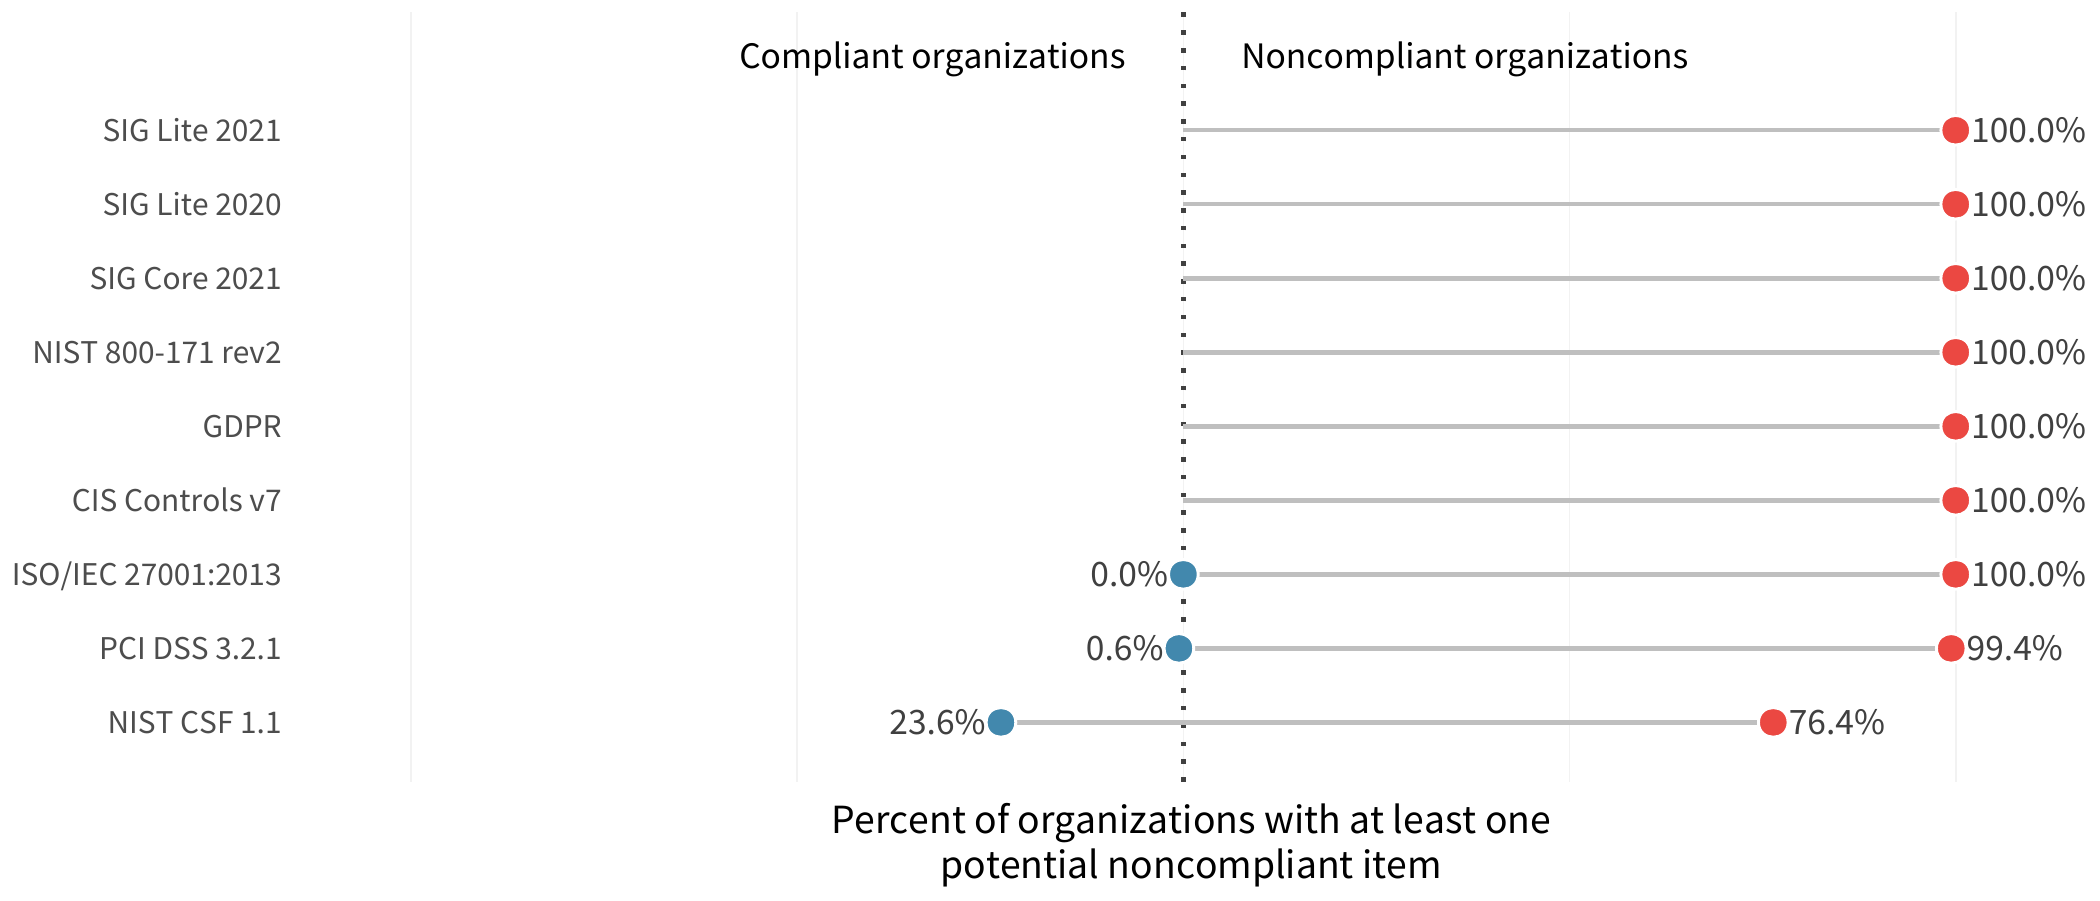
Now, this kind of absolutist view is not nuanced—clearly this does not mean that all organizations are entirely noncompliant with all of these major standards! The problem is that this basic calculation is binary. Having even one issue on one asset will put that organization in the noncompliant bucket. This isn't necessarily how auditors or risk managers operate—security isn’t a game of perfection, after all—so it doesn’t offer a full picture of how far out of compliance an organization is. After all, an asset with only one compliance violation may not raise an auditor's eyebrow, but the situation may change as the number of noncompliant items rises.
To be more useful, we reframe things a bit and assess the distribution of organizations based on the percentage of failed test items they experienced. Each item is a particular check for an issue, with some standards having multiple checks for each individual requirement. These are broken down by each compliance standard in graph below.
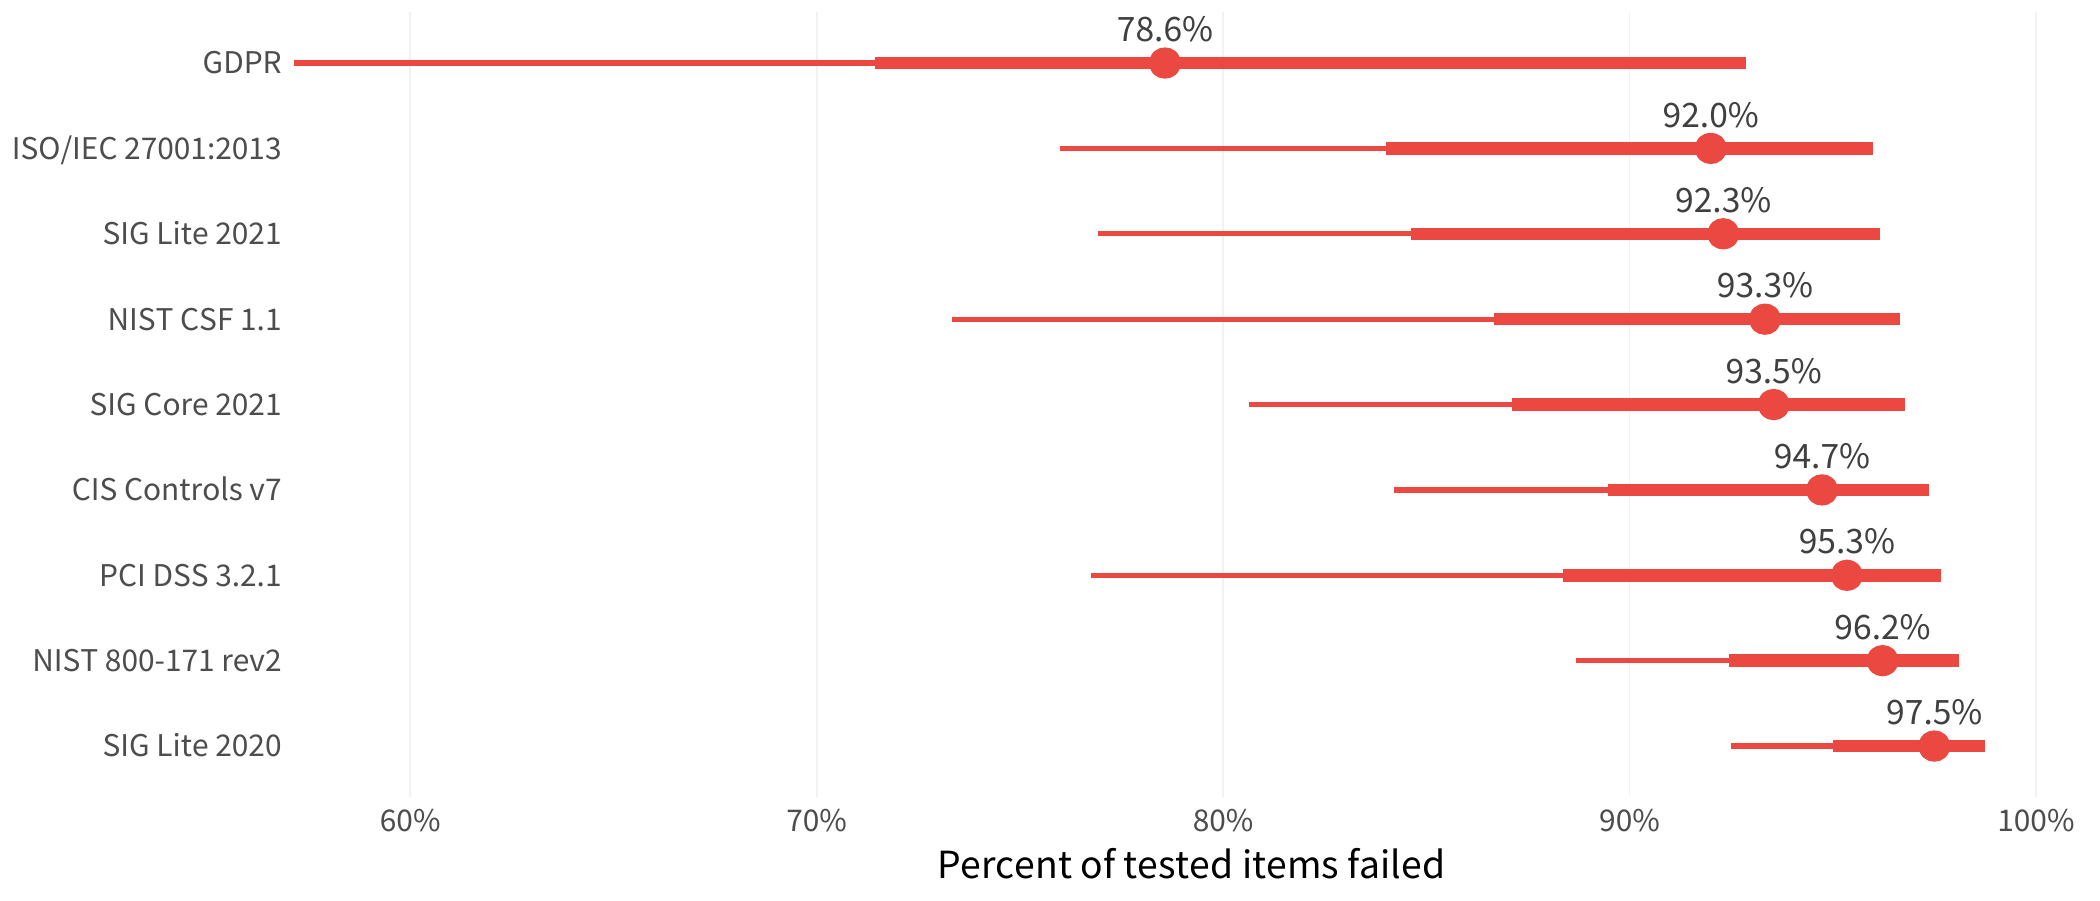
With this formulation, we start to get a bit more resolution in the data. The dots on the charts indicate the median points, showing that the majority of tested items show potential noncompliance in organizations. The bars on the chart indicate the range of items tested as noncompliant, showing a wide variation for many standards. Based on the compliance breakdowns, most organizations struggle with many more of the testable items from the SIG Lite 2020, NIST 800, and PCI requirements, while they are more successful with ISO 27001 and GDPR standards—but there is huge variability, particularly with GDPR.
Compliance in the Cloud
One worthy side note here is the relationship in compliance for cloud-hosted assets versus those systems hosted on premises. The data below shows that a host in the cloud is significantly less likely to have compliance issues than on-premises hosts.