


Recently we teamed up with the Cyentia Institute to examine the current state of third-party cyber risk in the healthcare sector.
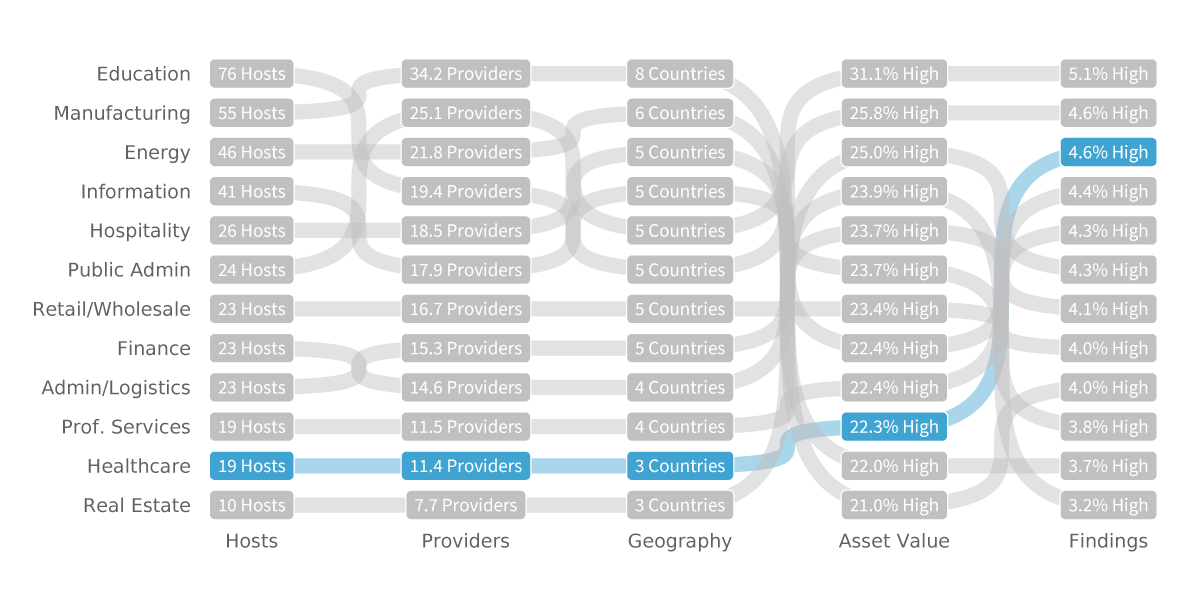
As Digital Transformation ushers in a plethora of changes, critical areas of risk exposure are also changing and expanding. We view the risk surface as anywhere an organization’s ability to operate, reputation, assets, legal obligations, or regulatory compliance is at risk. The aspects of a firm’s risk exposure that are associated with or observable from the internet are considered its internet risk surface. In Figure 1, we compare five key dimensions of the internet risk surface across different industries and highlight where the Healthcare sector ranks among them:
Hosts: Number of internet-facing assets associated with an organization.
Providers: Number of external hosting providers.
Geography: Measure of the geographic distribution of a firm’s hosts.
Asset Value: Rating of the data sensitivity and business criticality of hosts based on multiple observed indicators.
Findings: Security-relevant issues that expose hosts to various threats, following the CVSS rating scale.
The values recorded in Figure 1 for these dimensions represent what’s “typical” (as measured by the mean or median) among organizations within each industry. While there is a large amount of variation within each industry, what you see here is the general pattern. The blue highlights trace the ranking of Healthcare along each dimension.
FIGURE 1: COMPARISON OF RISK SURFACE DIMENSIONS AMONG SECTORS WITH HEALTHCARE HIGHLIGHTED
Healthcare’s high exposure rate indicates that managing a comparatively small Internet footprint is a big challenge for many organizations in that sector. This becomes even more apparent when examining the distribution of hosts with severe findings in Figure 2. Blue dots mark the average exposure rate for the entire sector (which corresponds to values in Figure 1), while the grey bars indicate the amount of variation among individual organizations within each sector. This reveals that the worst exposure rates in Healthcare are even worse than the worst rates in any other sector.
FIGURE 2: DISTRIBUTION OF HOSTS WITH HIGH OR CRITICAL FINDINGS IN EACH SECTOR
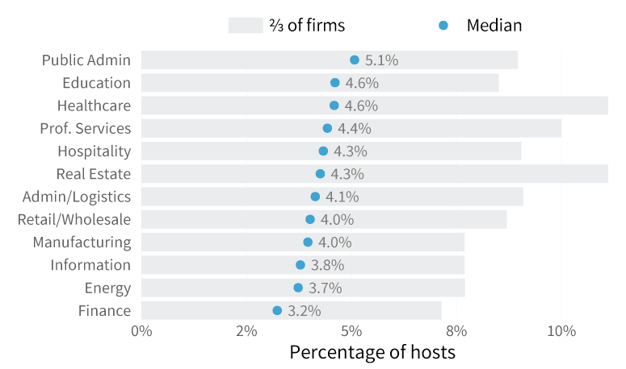
Figure 2 shows Healthcare
boasts one of the highest
average rates of severe security
findings (see blue dots). It also
exhibits huge variation (see
gray bars), meaning the worst
exposure rates in Healthcare are
even worse than the worst rates
in any other sector.
We also thought it would be worthwhile to briefly inspect how the size of healthcare institutions affects security posture. Bigger providers understandably have a larger risk surface stemming from more employees, more hosts, more services, and more third parties operating across more service areas. It could be argued that gives smaller institutions a security advantage because they don’t contend with that scale and complexity. The data from Figure 3, however, does not support that argument.
FIGURE 3: HOSTS WITH HIGH OR CRITICAL FINDINGS IN HEALTHCARE PROVIDERS BY EMPLOYEE COUN
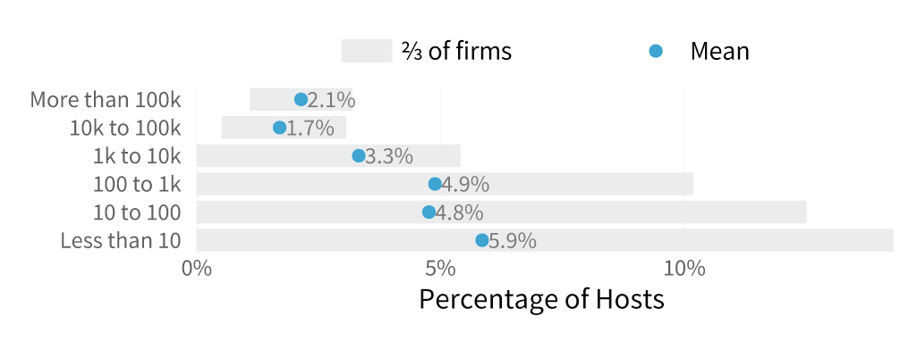
Regardless of size, the fact that healthcare institutions face an uphill battle against security hygiene is no surprise to anyone responsible for that critical mission. But we hope these findings add some helpful context regarding the extent of that battle and where’s it raging most intensely. If there’s a silver lining here, it’s that the risk surface isn’t (typically) as distributed as in some other sectors. That suggests gaining the visibility needed to pinpoint and rectify exposures on that surface is feasible.
Feel free to download the report to see the full findings from our study.


