In this post, we are looking at our analysis of nearly 9,000 breach events to determine the role of geography in those events, as well as examining the breach vectors and actors find correlations across these destructive attacks.
Geographic View
Meaningful analysis of geographic-specific breach events is difficult. Regional factors like regulations and cybersecurity capability strongly influence the number of breach events that are discovered and reported. The degree of targeting of companies in each region also influences the data.
Highlighting this reality, our analysis shows that about 2.5% of monitored companies in South America and Central America publicly reported a breach event between 2012 and 2021. In comparison, 6% of monitored companies in North America reported a breach. Does this mean that companies in North America have worse cybersecurity than companies in South and Central America? 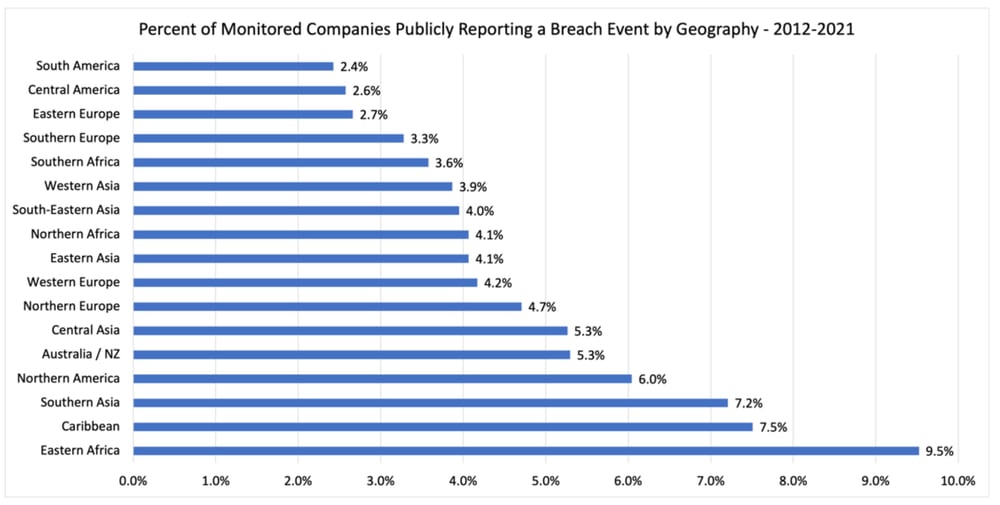
So, what can we conclude based on this geographic breach frequency data? Well, perhaps the following are worth thinking about:
-
Many countries are underreporting or are not detecting breach events. Is it a good idea to outsource sensitive systems and services to regions that don’t have strong cybersecurity and public breach reporting regulations? Regulations are a strong driver of cybersecurity investment. And public breach reporting rules put some accountability for performance on operators.
-
Regions with strong breach event reporting regulations, such as Western and Northern Europe, North America, and Australia, generally have higher publicly reported rates of breach events. Is this because they are getting targeted more often? Or are they just better at detecting and reporting? It is likely quite a bit of both.
-
The breach event rates of the regions with robust public breach reporting requirements likely are the baseline expected 10-year breach rate. That is 4.2% on the low end (Western Europe) and 6% on the high end (North America).
RiskRecon Risk Management Insights: In evaluating vendors and their operational geographies, think seriously about the strength of the cybersecurity regulations and public breach event reporting requirements of the region. Regulations enforced, over time, build a baseline of competency and discipline.
Breach Actors
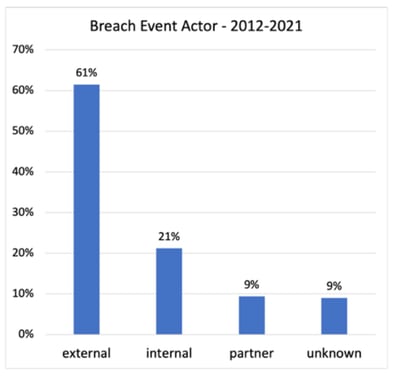 For 91% of the breach events, the public notifications disclosed the general threat actor. From 2012 through 2021, 61% of breach events were attributed to external threat actors, followed by 21% attributed to internal actors, and 9% to partners. The trend data tells a rapidly evolving story, with larger percentages attributed to external actors and partners, and a decreasing portion attributed to insiders over time.
External actors, outsiders compromising the systems of an organization, have always been the absolute majority, growing from 54% of breach events in 2012 to 69% in 2021. No doubt, the ability to monetize breaches through crypto-based ransom demands fueled this growth.
In terms of growth rate, breaches of partners/vendors took the top spot, growing 300% between 2012 and 2021. Given the massive amount of outsourcing of systems and services, it is reasonable to expect to see vendor breach events continue to grow at a high rate.
Relative to other actors, insider-driven events were subdued, reaching a low in 2021 of 12% of all events. This is a decrease from the high-water mark in 2012 when insiders were behind 33% of all events. Keep in mind, while insider activity decreased relative to the total events, insider breach events still increased by 50% over the 10 years.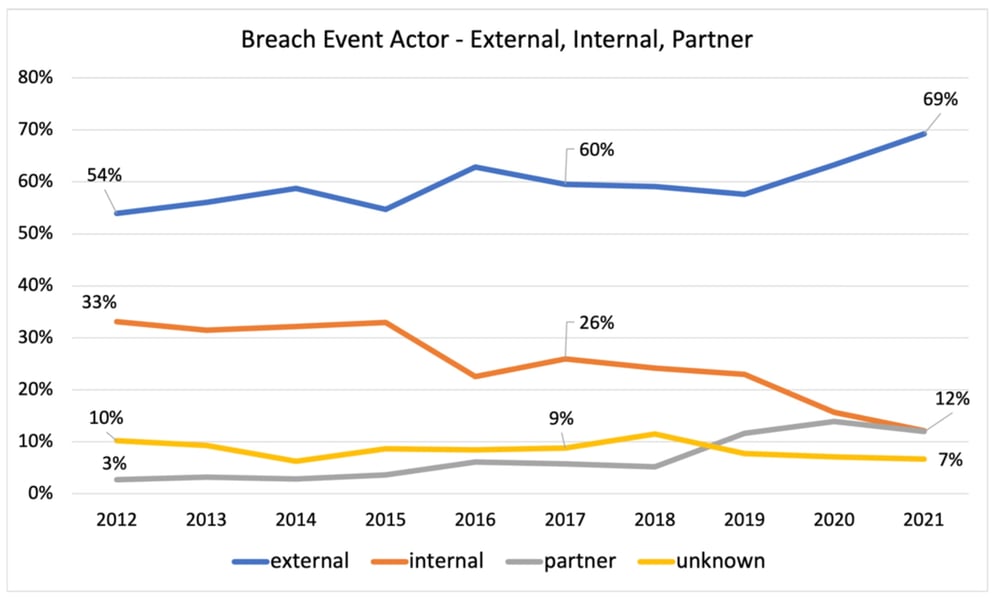
RiskRecon Risk Management Insights: Unfortunately, you can’t take your eye off any threat actor – they are all active. The count of events was higher for every actor in 2021 was higher than in 2012. One thing stands out though – external actors are pressing hard against enterprises and their partners. It will take a serious improvement in defenses to successfully stand against them.
Breach Vectors
The primary compromise vector was publicly reported for 85% of breach events, though often in generic terms. RiskRecon categorized the vectors into six groups:
-
Hacking – Hacking is the most generic category cited in breach disclosures, being a catch-all for remote system compromise. It is likely that public disclosures referenced hacking generically, rather than citing more specific vectors such as malware.
-
Malware – Malware includes all forms of malicious software, including ransomware, deployed to endpoints and servers.
-
Error – The error category captures all events in which persons with authorized access accidentally disclose sensitive data to unauthorized parties. For example, an administrator storing sensitive data on a publicly accessible S3 bucket.
-
Misuse – The misuse category contains all events in which a person with authorized access abuses privileges to steal sensitive data or commit fraud.
-
Physical – Events in the physical category are those in which the primary vector was a physical compromise, such as the theft of a backup tape.
-
Social – The social engineering events are those in which the compromise was perpetrated using social engineering techniques. The social engineering vector is likely significantly understated as most malware infections originate through a phishing campaign of sorts.
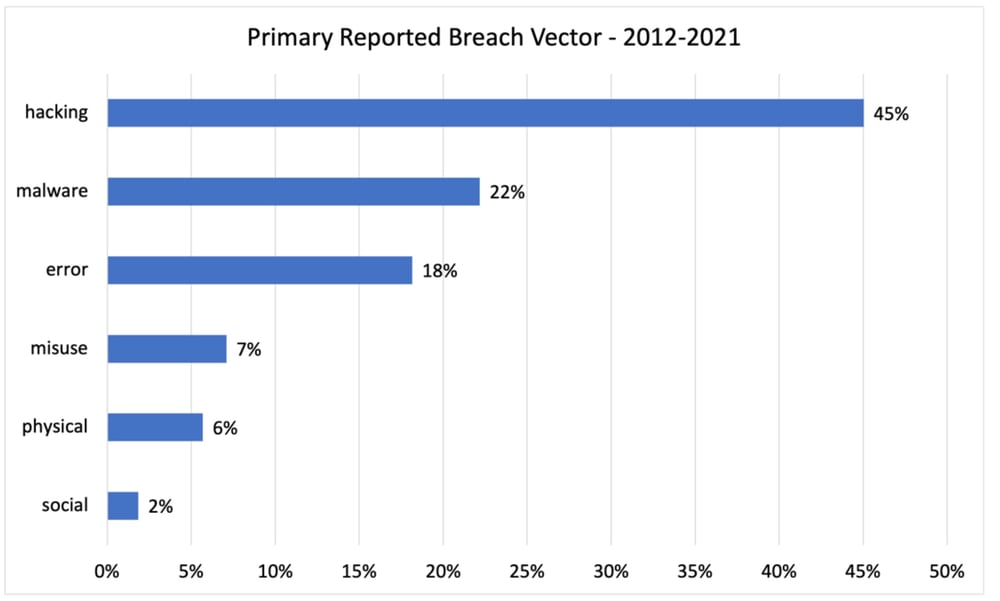
Hacking was the top vector referenced in public notifications, representing 45% of all breach events. Malware was cited in 22% of the cases, followed by employee error at 18% and employee privilege misuse at 7%. Social engineering was cited in only 2% of breach notifications, but this is very likely vastly understated as a large percentage of malware infections and credential thefts occur through phishing.
Different threat actors leverage different techniques. External actors are cited as hacking in 62% of the cases and as deploying malware in 29%. 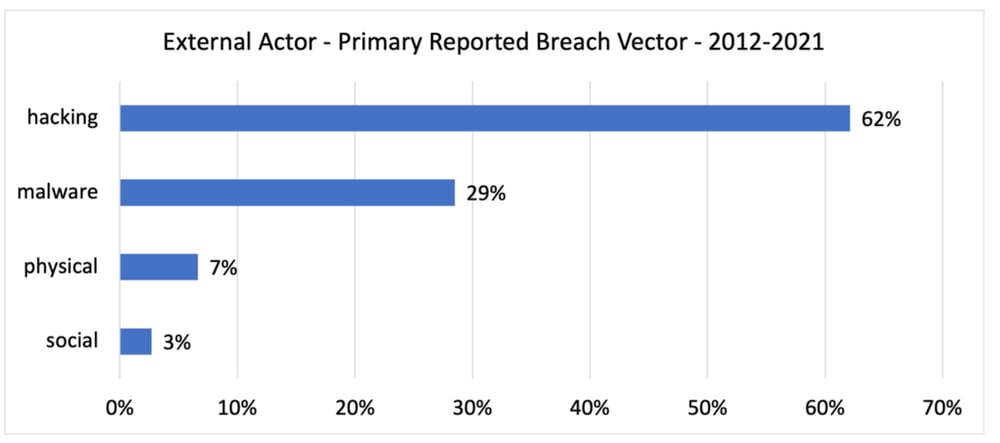
For internal actors, an error is cited as the leading cause at 64%, followed by misuse/privilege abuse in 27% of the breach events. 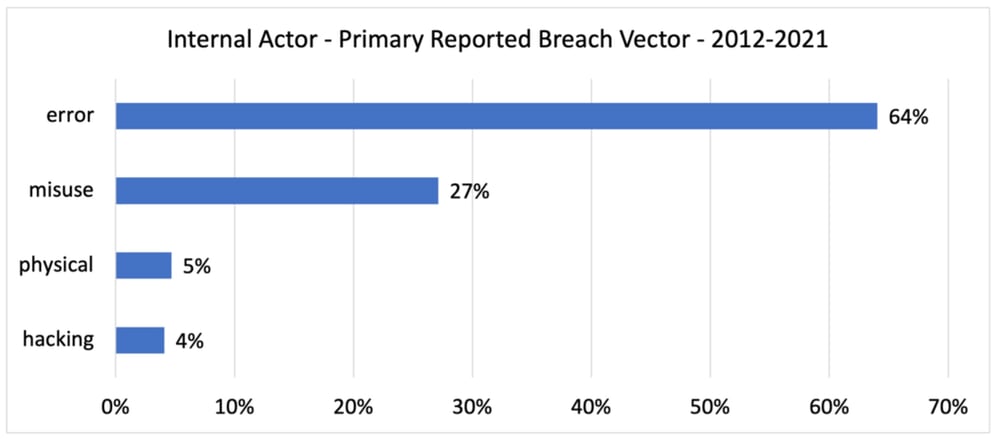
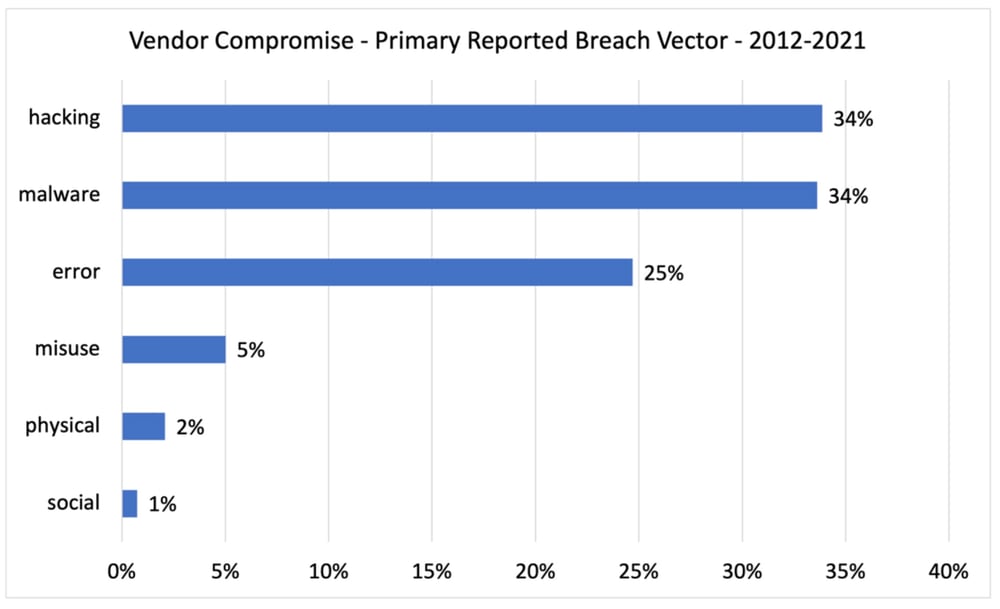
In vendor breach events, we see a mix of the insider and external vectors, where hacking and malware both come in at 34% and employee error comes in at 25%.
 Check back soon for most risk management insights and analysis from RiskRecon!