The Methods of Measurement
By Richard Seiersen: Risk Management Author, Serial CISO, CEO Soluble
“All models are wrong, some are useful, and some are measurably more useful than others.” The first part of this quote comes to us from George Box. His path to statistics was a winding one. His earliest job required him to test poisonous gases on small animals, a nefarious (and thankfully a short lived) career path! But that planted his statistical roots, and he became one of the most important and quoted statisticians of the last century. But the underlined portion of the quote comes from my co-author Doug Hubbard and points to the final installment of this three part series: The Methods Of Measurement. And indeed, some methods are measurably better than others!
In previous articles we learned about the concept of measurement. In a nutshell, measurement is about “retaining our uncertainty - without obscuring our certainty.” If that sounds too much like a zen koan to you, Read this previous article, and you will get it! We also learned about the object of measurement. Ours is:
Keep the likelihood and impact of third party breach within risk tolerance.
Our book How To Measure Anything In Cybersecurity Risk focuses on measuring problems like this. While I can’t possibly condense a whole book into one article, I will attempt to frame the method for building a model for something like this.
Where did you get that likelihood?!
There are formal definitions for likelihood. But for our purposes let’s say it’s the probability of an event. For example, what’s the likelihood of company xyz having a breach within the next year? If we say, “there is a 10% chance of breach” we are really saying that 10% is the most plausible answer. It’s not the ultimate truth, just the most plausible outcome given multiple possible answers.
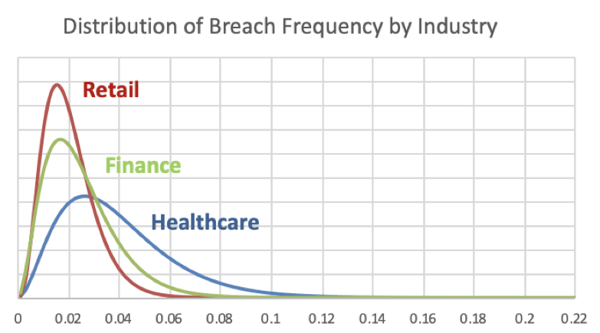
In the above graph, which you can download for free from our books site, you see the most plausible answers for the probability of breach. It’s at the top of each curve. The most plausible answers range from approximately 1% to 3% for each industry. But the ranges can vary. For example, healthcare could be over 8% or as low as 0.5%.
You can think of probability as a weighted scoring system. 8% is weighted pretty low for healthcare and 3% is weighted much higher. As stated, each outcome is possible, but this particular model thinks 3% is much more plausible. So, if you get to make only one bet, you bet on the most plausible breach rate: you bet on the top of the curve.
What you don’t see are all the assumptions that went into this. Our assumptions codified makeup our particular breach model - constrained to fortune 500 companies from 2014-2015. Specifically, it’s the subset of companies that are in each of the three industries. The model counts up the public breaches and the non-breaches over that two year period. It uses that data to spit out a bunch of probabilities including the highest weighted, or most plausible, ones.
Getting at what’s plausible given our data and model (assumptions) is super useful. For example, if you were modeling breach for your company and you came up with a 60% likelihood of breach - does that square with the model we are looking at here? Does it even square with observed reality? Probably not!
Becoming A Bookie
Why did I belabor all of this? Because you need to come up with likelihoods. You need to be able to do it even when you don’t have empirical count data! Beyond this, not only do you need to come up with likelihoods, you need to come up with impacts.
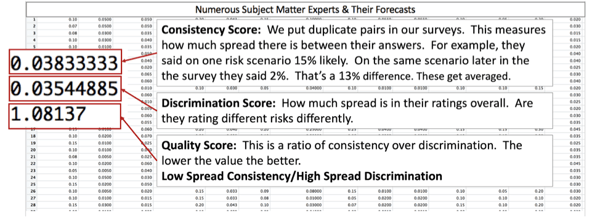
The chart above is a real example of collecting likelihoods en masse. It was a gamification of getting breach forecasts from a group of SMEs. The boxes in the middle are meta-scores for evaluating our individual SMEs. We use these scores to tell if people are cheating, paying attention or just plain bad at making forecasts. We then summarize their bets as such:
 The group above consisted of 40 “calibrated subject matter experts”. All that means is that they are trained to be more consistent at making forecasts about future events. We call them “security bookies.”
Real life bookies have been the subject of numerous scholarly studies. When a good bookie says something has a 90% chance of occurring, they are right 90% of the time. So, in short, our modeling process turns security pros into bookies, and we turn bookie output into automated models.
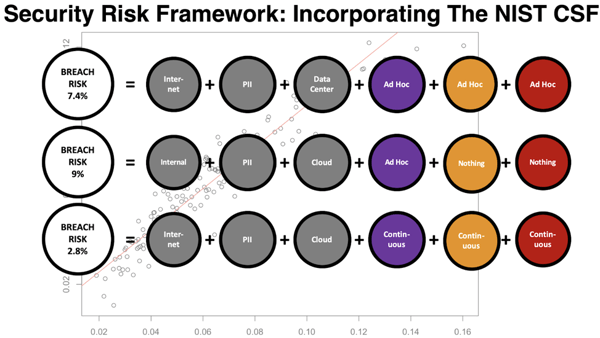
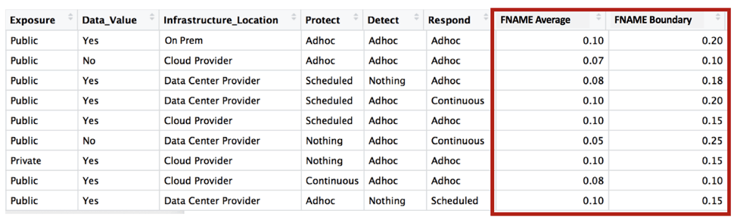
The above chart is a simple example of how subject matter experts (bookies) can be turned into a model. There is a small bit of “data science” going on in the background. It “learns” from the previously discussed expert forecasts to create breach likelihoods. We can now feed states into the model like “internet, pii, cloud...etc” to get the most plausible likelihood of breach given our assumptions. It’s not a perfect model for breach reality. It’s a model of our decision making about breach. And most importantly, it’s a more consistent and a mathematically unambiguous model. Or as my co-author would say, “it’s measurably better than the alternative.”
Show Me The Money
Forecasting impacts (money) is a little easier. This is simply a function of lower and upper bound dollar impacts. We formally calls these 90% confidence intervals. For example, you might forecast that a particular application could have a lower bound impact of 1 million records and an upper bound impact of 50 Million records persisted. That represents your 5% to 95% likelihood ranges. You don’t know the exact truth on record counts, you just bet that this value is 90% likely in that range. But, the assumption is that you have some vague knowledge about how much data may be persisted in the systems being modeled.
We also have models for determining breach impact monetarily. These models mash up historical data on breach impact on a per record basis. What we usually see in public records is that the more records breached the less impact (cost) per record. A small breach might have an impact of hundreds of dollars per record. A massive breach could be in pennies per record.
The records lost and cost per record models work together with our likelihoods. And each for these three factors (records, cost, likelihood) retain our uncertainty about reality. We have a range or records. We have a range of costs. And we have bounds on our likelihoods. We also retained our certainty given what we know about reality. Although imperfect, we know something about breach costs. We also know something about records persisted in our apps. And our expert model encodes what we know about breach likelihood in a mathematically unambiguous manner. Let’s now see how that all works together.
Bringing It All Together
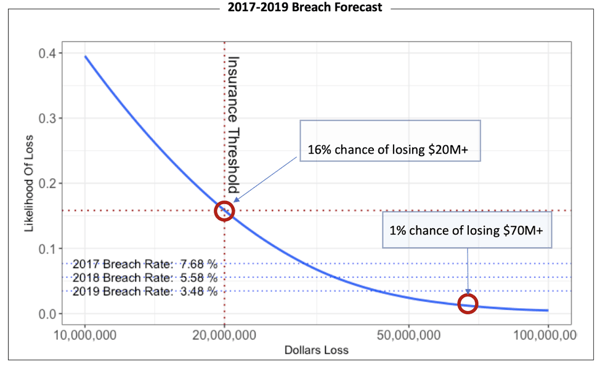
The graph above is a simple model that forecasts current breach rate for a given company and set of applications. The model starts with 2017 using current data. It then makes year over year forecasts through 2019. The model allows you to input your security controls rollout year over year. And it allows you to model your assumptions about the impact of those controls on breach. The idea in this model is to control for losses that may exceed some concept of risk tolerance.
Normally, we model risk tolerance as a curve. In this case, it’s a cyber insurance threshold. This model essentially says that you have a 16% chance of exceeding your breach risk tolerance of $20M dollars one or more times in a three year period based on your three year controls forecast. The question for you then, given all of your uncertainty about real outcomes, is if that is OK? Are you investing enough in controls? Should you raise you cyber insurance? And that is the point really, to help with decision making as opposed to substituting for it.
As you consider 3rd party driven breach as your number one risk - models like this become increasingly useful - especially with the incorporation of data from the likes of RiskRecon. This means that your original subject matter expert beliefs about breach can be updated with empirical data in near real time. It’s realtime predictive analytics for 3rd party risk management! The next generation of risk models will combine subject matter expert forecasts with empirical data in real time to better protect you from possible future loss. But you can get started right now!