No two companies are alike, but some are more different than others. Companies may find it more difficult to manage the risks associated with nth-party partners in a different industry, or of a different size, than their own organization. Risk managers at very large, mature enterprises, where processes including cybersecurity are spelled out in detail and meticulously followed, may find it challenging to understand and assess how a smaller, more ad-hoc, entity in a different sector approaches security. The risks would likely differ, as well.
In this blog we’ll examine how the distribution of different organizational types, particularly size and industry, varies as we move within the web of relationships within a supply chain. The graph below is a “worm chart” or
“subway chart” where you can see that professional services and finance top the list of first-party organizations – those that rely on other companies to get work done.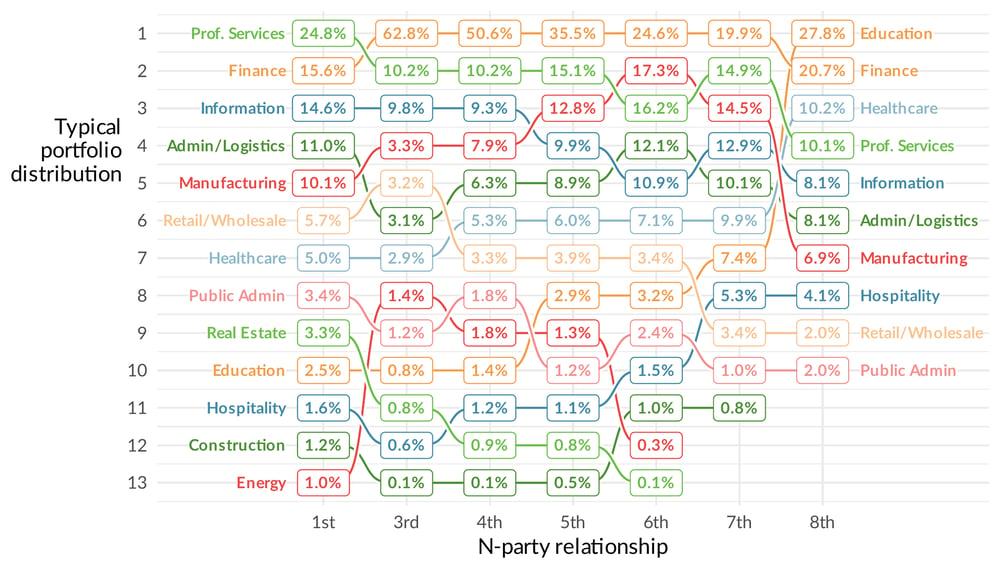
In the third-party position, though, professional services drop to second. What dominates? Finance, which holds the top spot all the way through until the eighth party, when education finally takes the spotlight. This makes sense. Every kind of enterprise needs financial services, and everyone watches their bank’s risk. Money makes the world go ‘round, right?
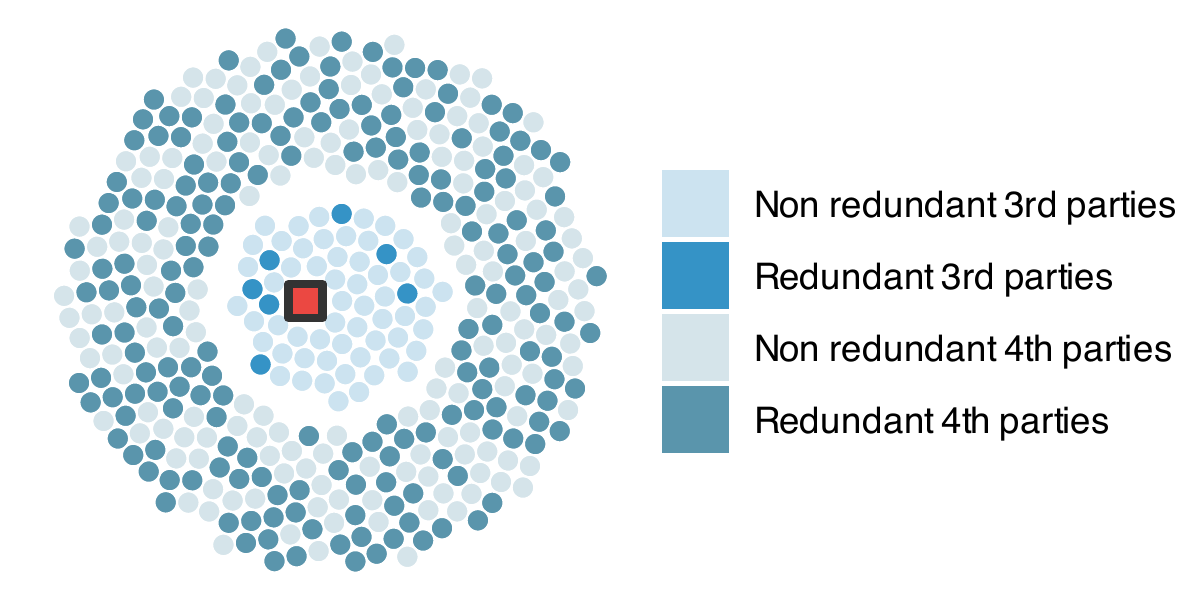
Perhaps most striking here is the extent to which finance dominates 3rd and 4thparty relationships. Given that these institutions tend to be large, it appears that the redundant connections we saw above are in large part made up of those financial institutions.
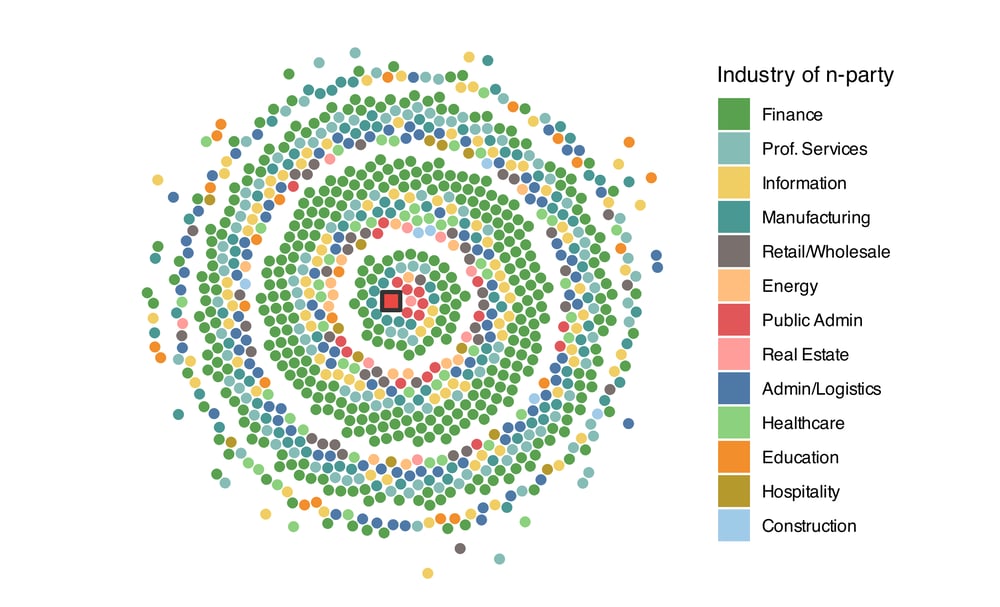
To see this sector diversity in living color, here’s our dot chart showing a typical organization's risk- management portfolio. Green – money-green finance – really dominates in the first couple of tiers, but other colors – gray-blue
professional services, yellow information, dark blue administration and logistics – take up more space in the fifth-party tier and beyond.
The typical nth-party risk portfolio contains a kaleidoscope of industries. Why does this matter? Business risks tend to rise with every nth-party’s difference from your own organization. Those in other sectors – and of other sizes – may have business models, goals, and ways of operating that are unfamiliar to you, making managing the risks associated with them more challenging.
Trying Nth Parties on for Size
Industry is not the only way that we can examine how organizations are distributed about the supply chain. Do organizations rely on larger or smaller partners and at what level? The figure below has the answer. 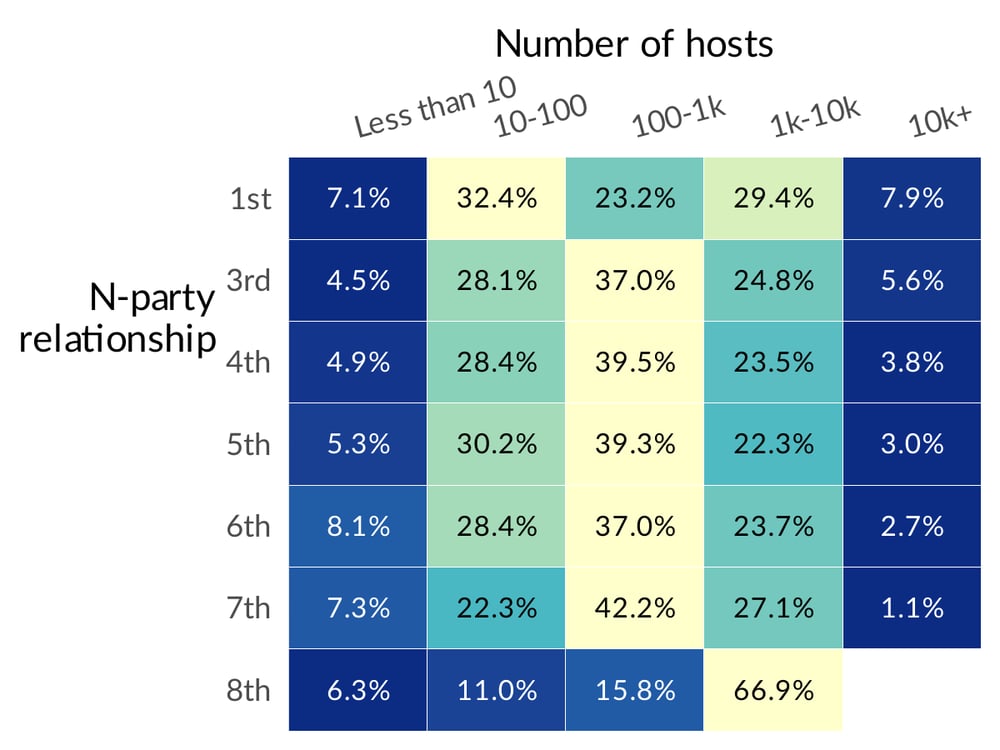
This chart groups N-parties according to the number of hosts, or computers, their enterprise has. Most organizations in our study fell into the middle range, having between 100 and 1,000 hosts at every level except the eighth party. Larger enterprises with between 1,000 and 10,000 hosts were most likely to have an eighth-party relationship; very large businesses were an eighth party to none, recalling that that 8th-party circle is exceedingly small.
But this only tells part of the story, what may be more instructive is whether the organizations in your supply chain are bigger or smaller than your own. This can have implications for the way they handle their security operations with larger organizations potentially being bigger targets but more equipped to handle attacks, the chart below makes the size comparison level by level. 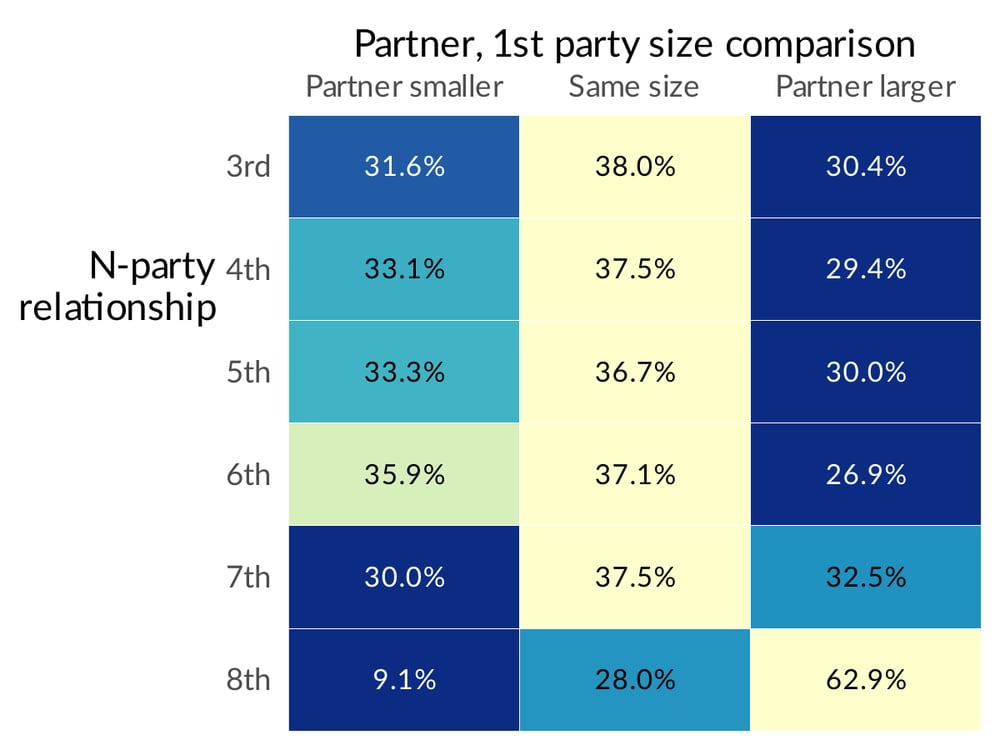
We see here that at nearly every level, third-party to seventh, companies are somewhat more likely to monitor the risks of partnerships with businesses that are their own size.
This finding is seemingly at odds with the observations that financial organizations (who we expect might be large banks) are at the top of the 3rd and 4th-party lists by a longshot. Perhaps this is evidence that mid-sized organizations may like to partner with mid-sized financial institutions, trying to tailor their supply chain to organizations that look like themselves.
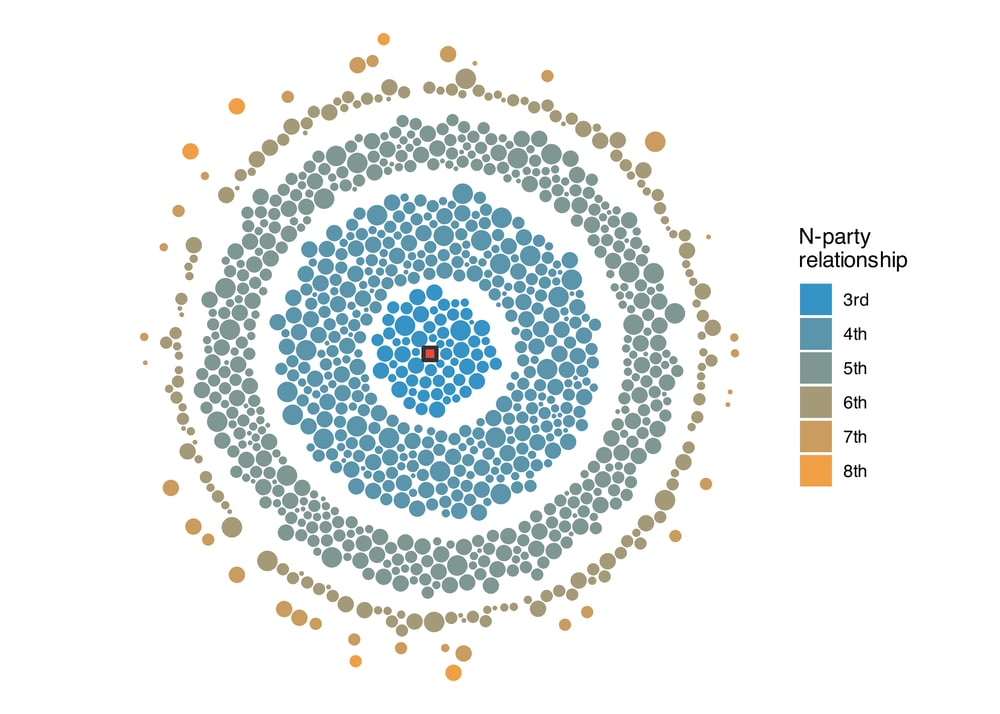
Finally, let’s take a look at how this size distribution is realized in our example organization. Given that size is a natural fit for the now familiar circle of circles, we can scale each organizational partner by that typical size distribution as shown in the image below.
As we press on in our quest to comprehend the influence of Nth-party risk in your supply chain, we will delve deeper into the wide-ranging nature of Nth-party risk in our upcoming blog post. Don't miss out on the complete findings of our study – download our comprehensive research right here to uncover all the intricate details!