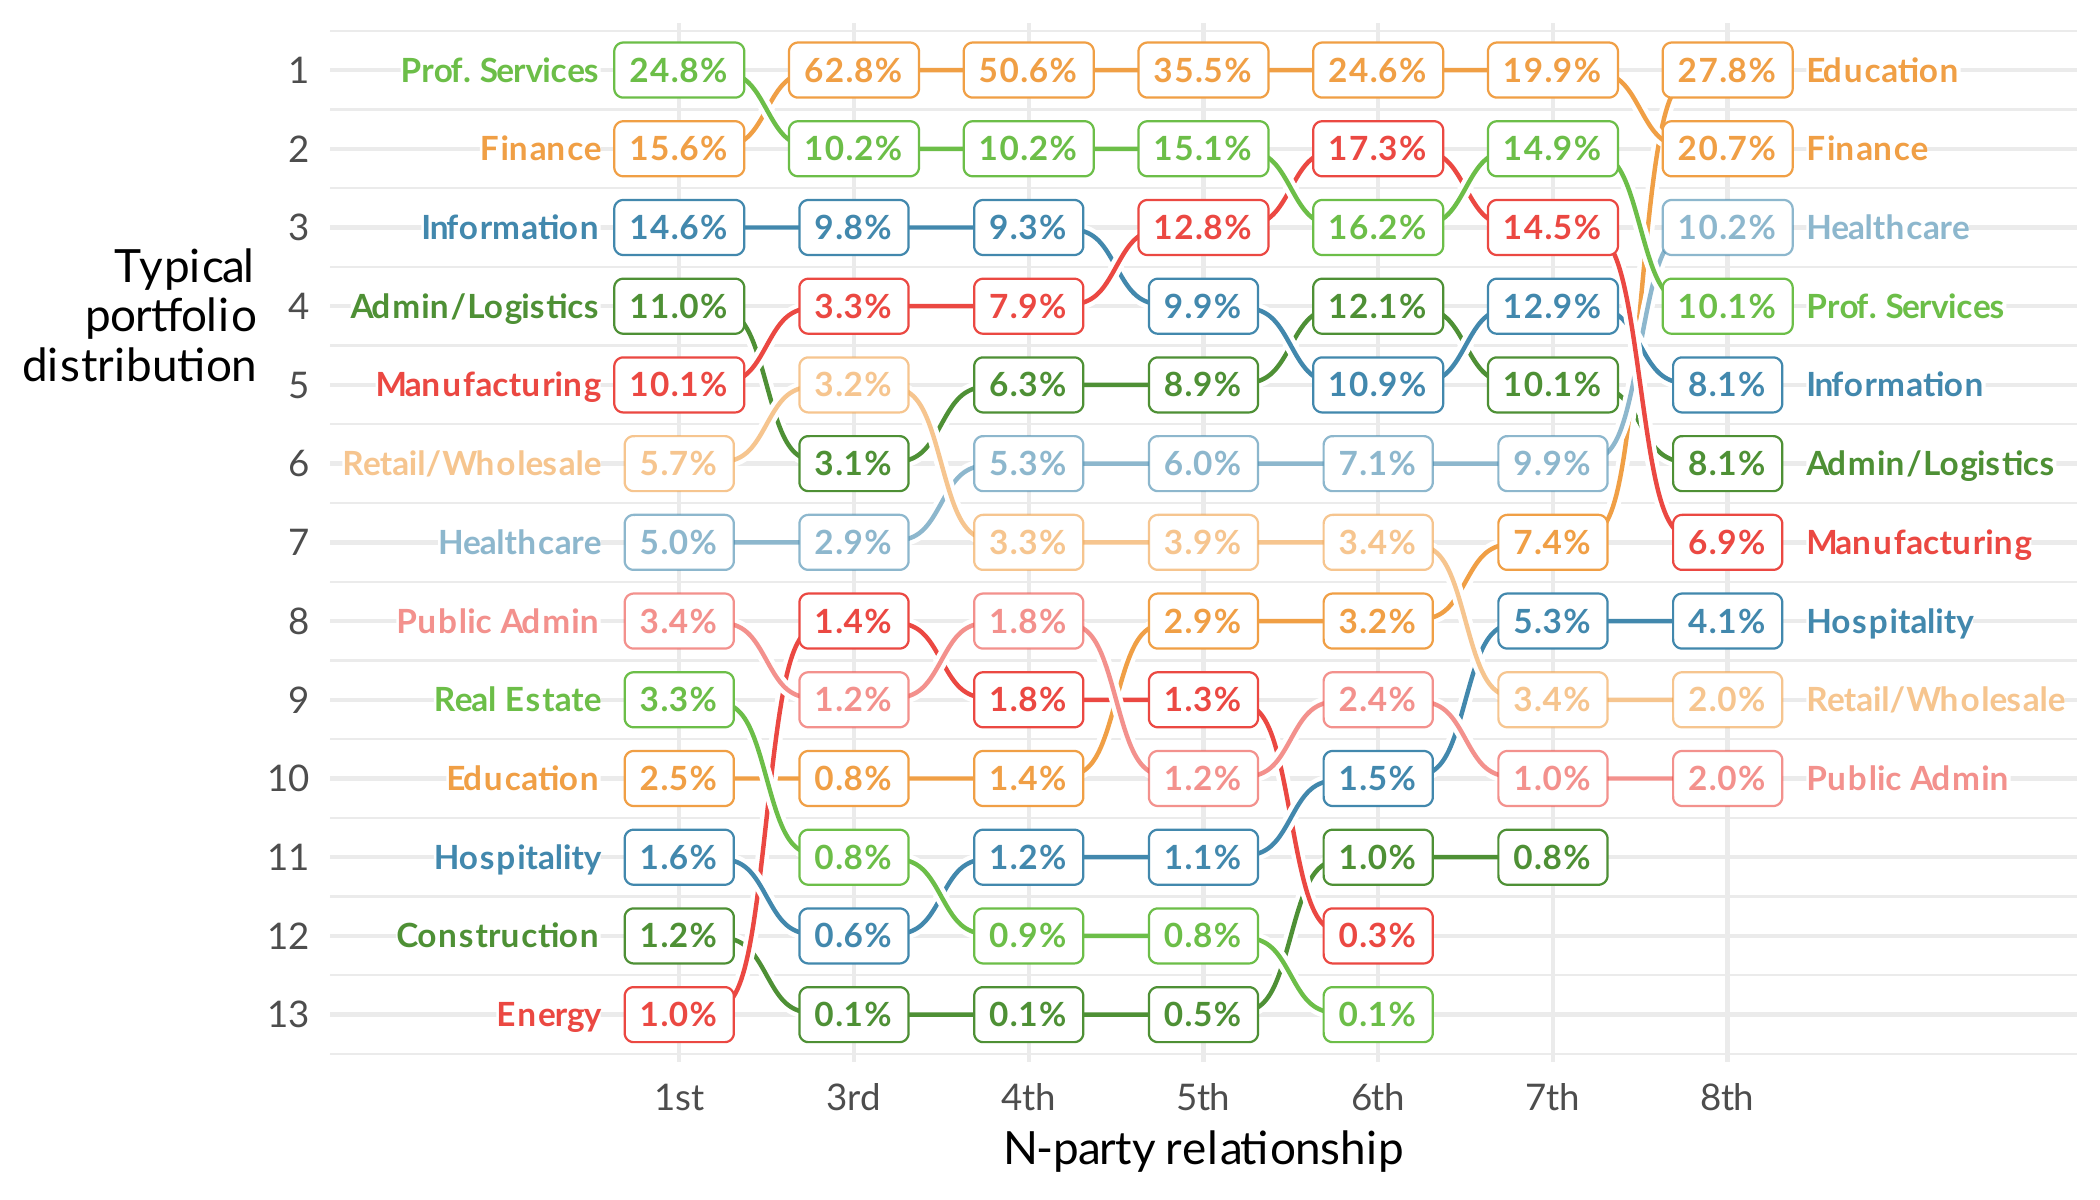
In this blog, we will try to understand exactly what types of organizations exist at each level of the supply chain and the risk they pose, it’s useful to move from the summaries we’ve presented above to an illustrative example. To that end we imagine a theoretical organization with a nice round supply chain composed of 1,000 different suppliers. This is a convenient number because then each organization makes up exactly 0.1% of an organization's supply chain. Given the numbers we saw in Figure 2 in our last post, this is a little on the high side of “median” for a supply chain.
This theoretical organization will serve as a foil as our analysis unfolds, and give us a better idea of how Nth-party risk might affect the “typical” organization. We visualize this organization in the image below. 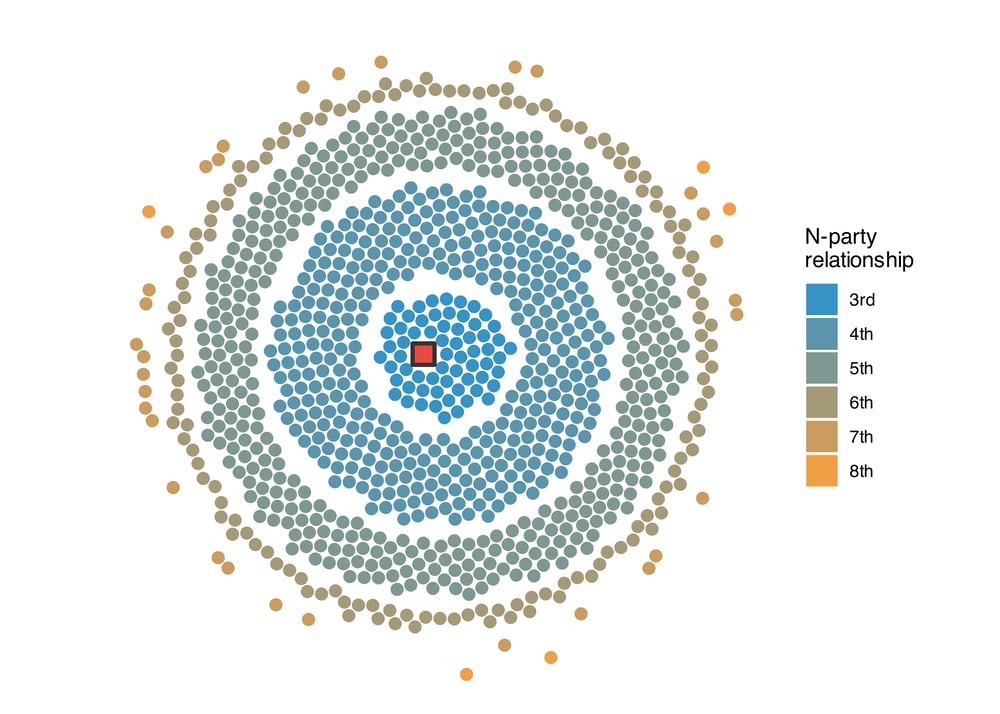
Each dot in the image represents a single node in our example organization's supply chain with the square in the middle the “1st party” – the organization itself. All of the dots are the same size and are colored simply by their distance from the 1st party, but as we explore further this example organization will evolve and we can uncover layers of complexity we hadn’t seen before.
Recurrent Connections: Doubling Down on Risk
Why does the number of dots in our chart decline so rapidly as they branch out from the primary organization? Third parties tend to be connected to each other. The answer is somewhat simple, many of your third parties rely on each other. What human-resources software do you use? Your other third parties may use it, too. Or perhaps a video-conferencing solution that your business partner uses – one that you don’t use – also gets used by that company’s third parties – your fourth parties – as well as by some of your third parties.
Recurring connections like these happen quite often, making nth-party networks quite dense, especially at the third, fourth, and fifth-party tiers. Enterprises connect again and again. Your third party may be your fourth or fifth party’s third party, too, and vice-versa. Every connection and reconnection represents another risk to your organization. If, in the course of all these connections, a business whose services you use is digitally connected several times to other businesses, the jeopardy could double, triple, quadruple, or more. This can mean incidents or outages at one 3rd or 4th-party can affect multiple others. To what extent this is the case we start to examine in the following charts. 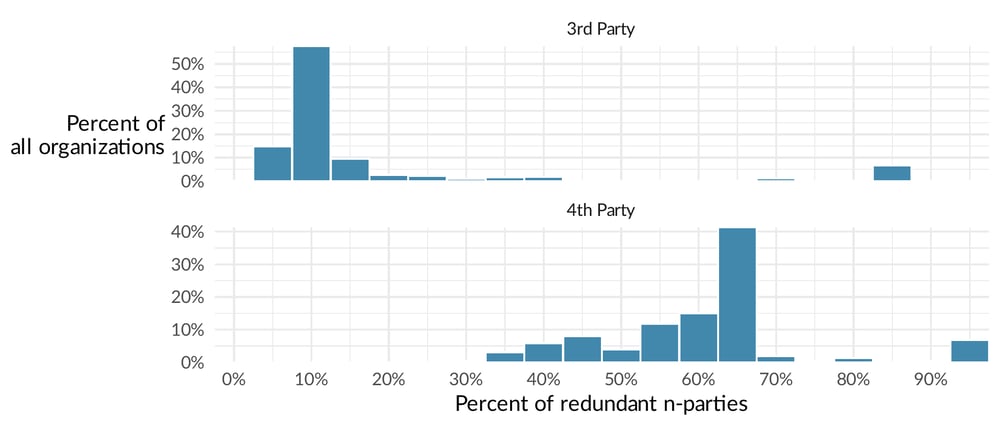
These charts indicate that for most organizations there are some (but not staggering) recurring relationships among an organization's 3rd parties. That is, typically among those 3rd
parties 18% will be relied upon by other 3rd parties. There are some outliers however, with some organizations (around 5%) having upwards of 80% of or more of their 3rd parties having connections among themselves. However, when we move to 4th parties things get a little bit more dense.
On average, 61% of an organization’s fourth parties are relied on by multiple third parties. This means an incident at one of those 4th parties is likely to affect multiple 3rd parties. This of course raises the question, exactly how many? To find the answer, we’ve isolated the interdependent Nth parties from those that have no interconnections to see just how often these connections recur. How many companies in the network are using the same product or service providers and examined the distribution in the graphs below.
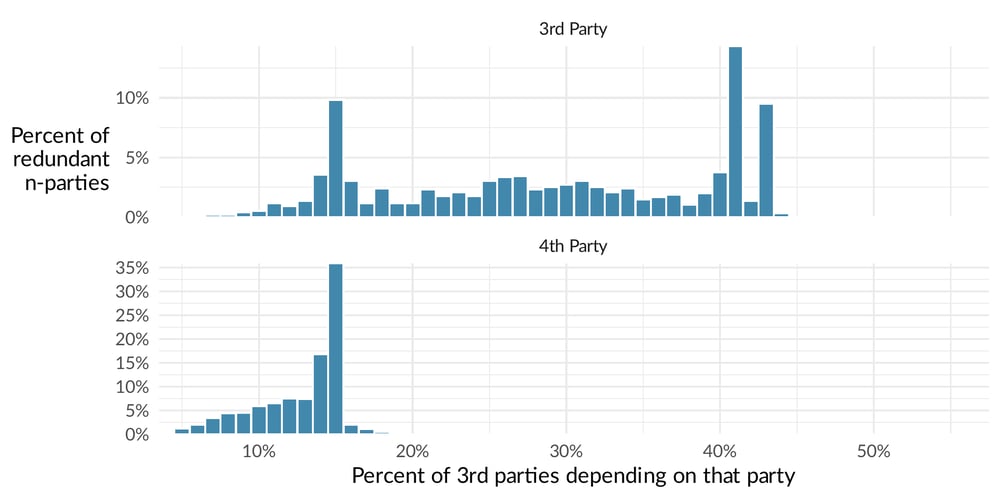
When a third party is relied on by multiple other 3rd parties, it is typically relied upon by nearly one- third – 29% – of those interconnected parties. Sometimes, as many as 40% of these third parties will all use the same other third party! If something goes wrong at that oft-used company, nearly half your business partners – and your company – could also suffer. The risk is less concentrated but more dispersed at the fourth-party level. When a fourth party is relied on by multiple third parties, typically it’s used by 12.8% of them. But as we’ve seen, more fourth parties are frequented multiple times than are third parties.
The balance here is interesting and not necessarily a foregone conclusion. Third parties are less likely to be relied upon by other 3rd parties, but when they are, that reliance usually makes up a large percentage of your 3rd parties. This is likely due to the direct reliance on service providers or financial institutions. These big suppliers are likely to be relied upon by just about everyone making the extent of their connectivity vast. Let’s look at what this means for our example organization in this figure.
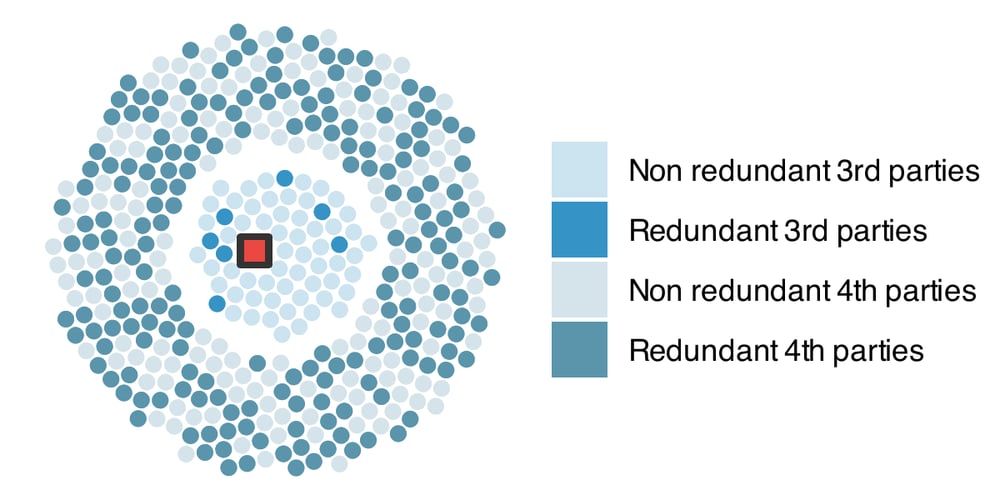
The orange square in the center is, again, our example org. The dots closest to it are all its third-party partners and those in the outer ring are its fourth parties. The dark dots represent third or fourth parties that other third parties also use. As you can see, the number of third parties with multiple connections in the network is somewhat small but not insignificant. And it’s very common for fourth-party organizations to be affiliated with more than one of your third-party partners.
To show the extent of that reliance, we’ve selected a single “sample partner” and colored it orange in the graph.
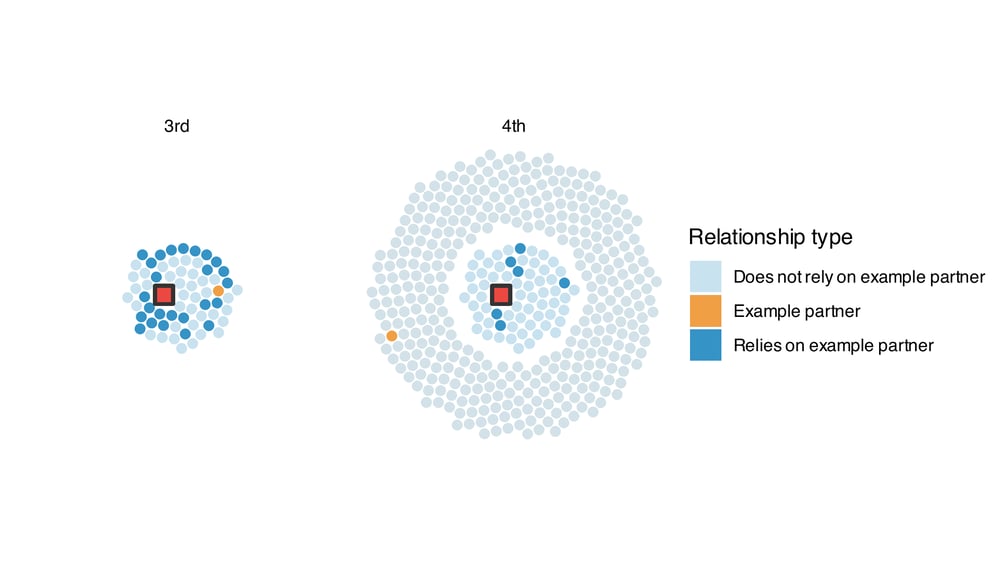
If the sample partner is a third-party business partner of yours, it will more likely have connections with other third parties. If it’s a fourth party, other third parties will still rely on it, but not as many. Nevertheless, an attack or disruption at a single third or fourth party is likely to affect more than just your organization.
We will delve deeper into uncovering the areas of supply chain risk and provide valuable insights on where you should direct your efforts to safeguard your business in our coming blogs. If you're eager to explore all the intricate details of our study, feel free to download our comprehensive research here!