Earlier this month, we released a 10-year study of breach events, spanning the years 2012 – 2021, covering 109,000 closely monitored organizations. Our detailed analysis of these companies and the nearly 9,000 breach events these organizations reported reveal many valuable insights that we are confident will be powerful inputs to your risk management program. Here are just a few interesting stats:
- Between 2012 and 2021, 5.5% of companies publicly reported at least one breach event.
- Comparing 2012 to 2021, publicly reported breach events increased by 314%.
- The peak breach year of the study period was 2020, during which 2.28% of companies publicly
reported at least one breach event. - Healthcare had the highest rate of breach events, with 17.8% of organizations reporting at least
one breach during the 10 years. The education sector had the second highest rate, with 17.2% of
organizations reporting a breach during the same period. - Organizations with the largest attack surfaces, having greater than 5,000 internet-facing
systems, have a 64 times greater frequency of publicly reported breach events compared with
the smallest companies, having 10 or fewer systems in their attack surface. - Sixty-five percent of breach events are publicly reported within 30 days of a breach.
- Twelve percent of breach events took more than six months to report after the date of the
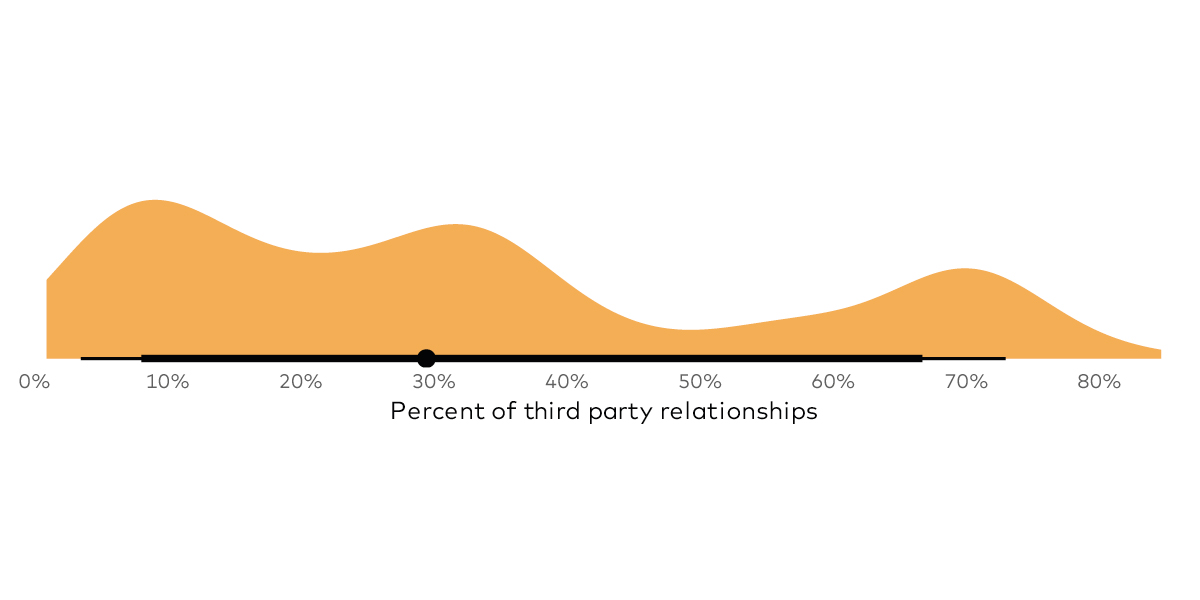
initial compromise. - Breaches of vendors take 80% longer to report than internal breach events – 4.1 months
compared with 2.2 months. - External actors accounted for 61% of breach events. Internal personnel accounted for 21% of
events. Partners accounted for 9%. The remaining were unknown. - From 2012 to 2021, five of the nine major U.S. holiday windows had a higher breach rate than
the average daily breach rate. The days surrounding Veterans Day had the highest holiday- related breach event frequency, running at 253% of the average. Christmas and Thanksgiving also ran hot at 187% and 140% on average. - The breach event frequency for companies with very clean cybersecurity hygiene (‘A-rated’ by RiskRecon) was nine times lower than for companies with very poor cybersecurity hygiene (‘F-rated’ by RiskRecon).
In this post we will go through the methodology behind our research and touch on the key elements we examined. The full report has many more insights, with loads of graphs and data visualizations. Whether you are charged with protecting your own enterprise infrastructure, managing third-party risk, or underwriting cyber insurance policies, we are confident you will find many valuable insights here that will help you better manage risk.
Methodology and Study Population
RiskRecon continuously monitors the cybersecurity hygiene of over five million organizations, spanning all industries and nearly all parts of the globe. For purposes of this study, RiskRecon selected 109,000 companies for which RiskRecon maintains human-supervised, continuous cybersecurity assessments on behalf of its customers which have particularly high-risk relationships with these organizations. Beyond continuously analyzing the cybersecurity configurations of each company’s internet-facing systems and related signal intelligence, RiskRecon analysts catalog breach events occurring within each company. Analysts source data loss events from channels such as public media, regulatory filings, and dark web monitoring.
For purposes of this study, breach events are limited to the 10 years spanning January 1, 2012, through December 31, 2021. Analyzing events one year after the end of the study window ensures that nearly all breach events that are going to be publicly reported have been reported. From each of the breach disclosures, RiskRecon analysts recorded data such as the breach event date, the breach disclosure date, the primary actor, the reported compromise vector, and the number of records stolen. This data, combined with RiskRecon’s cybersecurity ratings and assessment data, combine to reveal some very interesting insights.
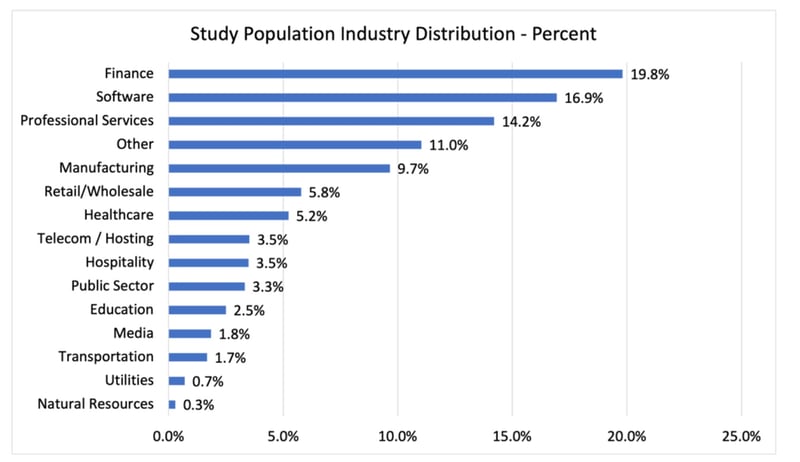
Industries
The study categorizes the organizations into 14 specific industries, with the remaining placed in the category of “other”.
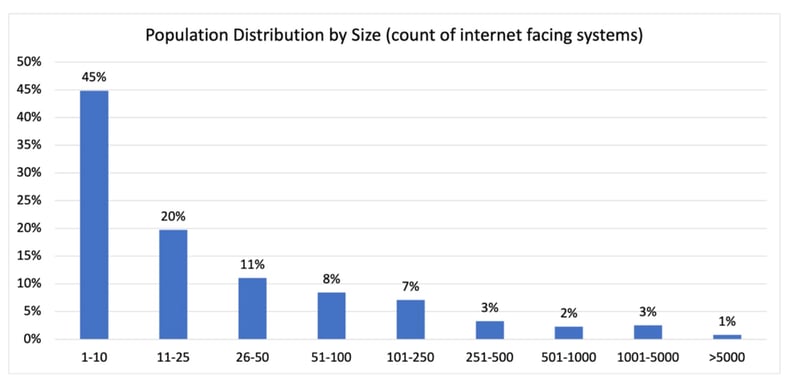
Size
The study population includes companies of all sizes of internet-facing infrastructure. Forty-five percent of companies have 10 or fewer systems in their internet attack surface, while just 1% have more than 5,000.
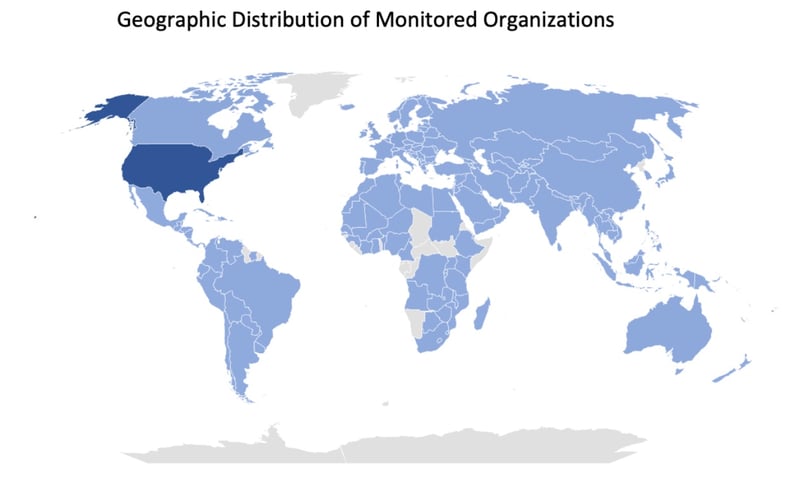
Geography
The study encompasses companies with primary centers of operation in 191 countries. Most of the organizations are based in the U.S., accounting for 70% of the population. Great Britain and Germany each account for around 3.5%, followed by Canada, Netherlands, and France, each accounting for between 1.5% and 2%.
Disclaimer
Public breach event notifications are biased and unevenly reported over time. Not all companies publicly report all breach events; it varies based on factors such as geography, industry, the quality of governance, and even the ability to detect a breach at all. Even for countries that now have strict public breach reporting requirements, such as the United States and Europe, the reporting requirements were not as strict in 2012 as they were in 2021. So, we do our best with the data we have.
Top-Level View
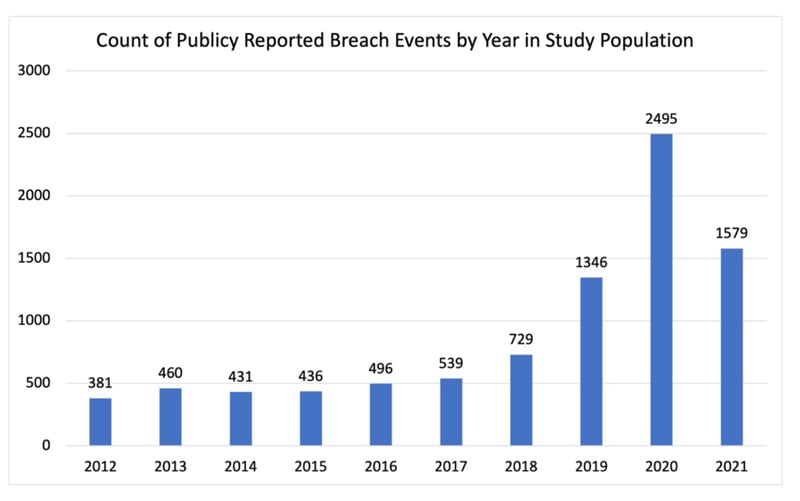
Between 2012 and 2021, RiskRecon analysts identified 8,892 publicly reported breach events within the population of 109,000 organizations. The year 2020 had the highest number of breach events at 2,495. Comparing the first year of the study to the last, publicly reported breach events increased by 314%. With only two exceptions, 2014 and 2021, each year had a higher number of breach events than the previous year.
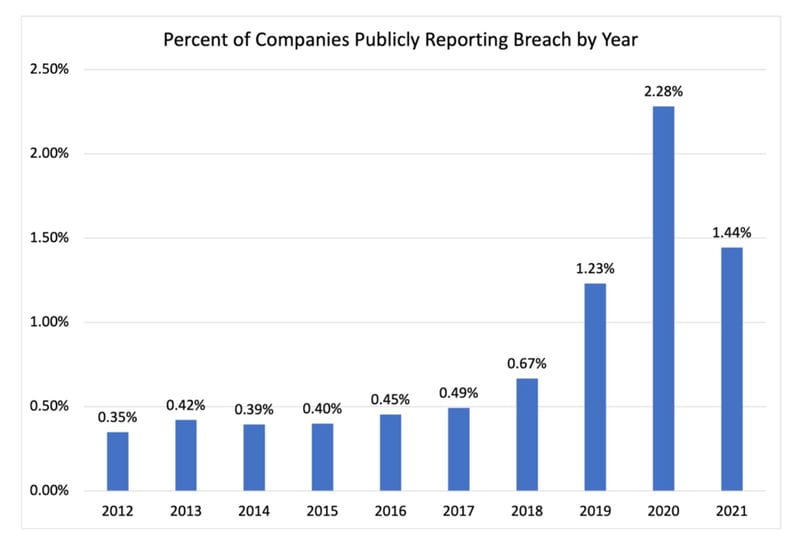
From 2012 through 2021, 5.5% of the companies (6,015) publicly reported at least one breach event – just over 1 in 18. The peak breach event year was 2020, with 2.28% of companies publicly reporting at least one breach. In 2021, the number of companies reporting a breach event was 311% higher than in 2012.
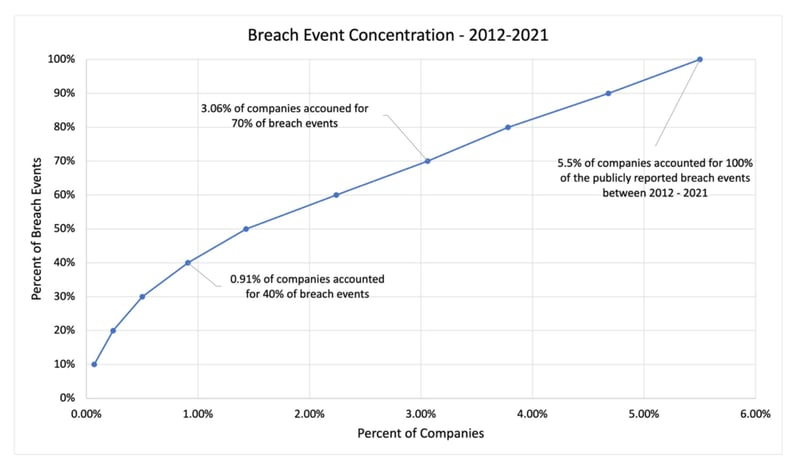
Some companies reported more than one breach event, given that 6,015 companies publicly reported 8,892 events. Three percent of organizations accounted for 70% of breach events, with 2.5% of organizations making up the remaining 30%.
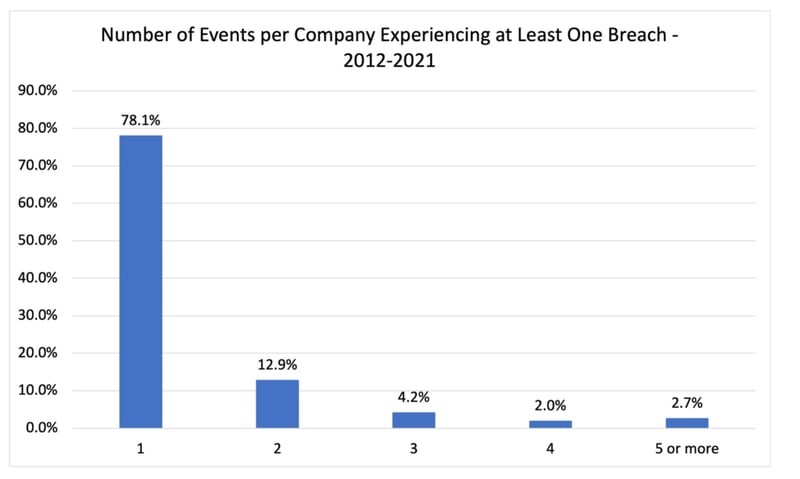
Of the organizations reporting a breach between 2012 and 2021, 78.1% reported one event, while 2.7% reported five or more. Of the top 10 organizations disclosing the highest number of breach events, four were Western governments, three were healthcare organizations, two were social media companies, and one was a software company.
In a series of upcoming posts, we will dive deeper into the statistics mentioned above and offer insights from RiskRecon experts that can help strengthen any programs approach to risk management.