Organizations have a lot of assumptions about third-party risk. Many assume their vendors have terrible security posture and represent grave danger to their business. Others assume the opposite— that their partners are probably decent folks doing the best they can to work together securely. Sometimes annual questionnaires form what organizations believe about their vendors’ security posture, but that only shows what they want you to know. Thankfully, it’s not necessary to make blind assumptions about third-party risk.
The teams from RiskRecon and Cyentia Institute have teamed up once again for an exclusive research report - in this version, we used data from security assessments of over 50,000 business-to-business (B2B) relationships to investigate the equity of these relationships from a cybersecurity perspective. Expect that some of your assumptions about third-party security will be shattered while others confirmed so they become true actual knowledge.
In this blog series, we will explore the finer points made throughout our report, starting with the methodology and firmographics.
Report Methodology
In our Internet Risk Surface Report, we explored implicit relationships between organizations and their third-party providers based on RiskRecon’s external assessments. This report is different in that we’re focusing on explicit relationships that are manually configured by organizations using RiskRecon’s platform. In other words, we’re examining curated portfolios of vendors and suppliers tracked as part of organizations’ third-party risk management program.
Before moving forward, it’s important to note that the data provided to Cyentia for this analysis uses anonymous IDs for all primary and third-party organizations. This allows us to study the relationships between organizations without identifying information other than basic firmographics.
We started with a dataset extracted from RiskRecon’s platform consisting of over 100,000 primary organizations and more than 300,000 monitored third-party relationships. We’re focusing on direct relationships in this report, but the data supports the analysis of indirect (fourth- to nth-party) relationships. We’ll explore those nth-degree relationships in future research.
A large majority of organizations are monitoring a small number of third parties. Since we’re mainly interested in insights relevant to more mature third-party risk management programs, we decided to construct our sample from firms tracking at least 25 third parties. To put that into perspective, our 2020 State of Third Party Risk Management survey found that 60% of respondents assessed 25 or more vendors each year.
Using that threshold, we extracted a sample of approximately 1,000 primary organizations spanning 50,000+ third-party relationships. We also leveraged RiskRecon’s security assessment of the domains and internet-facing systems associated with both primary organizations and all third parties they monitor. This forms the basis of the security posture comparisons we make in this report.
Some terms we use in this report:
First party: The organization monitoring another party using RiskRecon. We also refer to first parties as “primary” or “sourcing” organizations.
Third party: The organization being monitored by the first party.
Relationship: The one-to-one connection that exists between the first and third party. Organizations can be part of many relationships and be the first party in one and third party in another.
Third-Party Firmographics
Below, we provide information about the primary or first-party organizations in our sample and their third parties. We’ll start with the number of third parties monitored and then touch on the industries, sizes, and regions represented.
We mentioned in the methodology section that we excluded organizations monitoring fewer than 25 vendors, so it seems a good starting point to measure what’s typical among those in our sample. On average, each organization tracks about 50 vendors in their portfolio. The largest 5% of portfolios contain 100 or more third parties.
.png?width=2100&height=900&name=fig01%20(1).png)
Next, let’s look at an industry breakdown of primary and third-party firms. Per the leftmost column in the chart below. Finance, Information, and Professional Services together comprise over 80% of primary organizations. Finance is still on top among all third parties in our sample (second column), but Manufacturing is placed in the top three, and Professional Services ranks at number 4.
The third column is a bit different. It shows the ratio each industry typically represents within primary organizations’ third-party risk portfolio. So, financial firms typically represent nearly 70% of the vendors monitored by each organization, and no other industry claims more than 10% of the portfolio. “For where your treasure is, there will your heart oversight be also” seems an appropriate (adapted) quote.
.png?width=2100&height=1050&name=fig02%20(1).png)
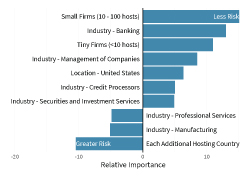
What about the relative size of first and third parties—who’s the bigger player? We measured size in this case based on the number of internet-facing hosts for each organization. The image below makes it plain that primary organizations are larger than their third parties in over half of the relationships we examined. Vendors are a larger party about 30% of the time, and the remaining ~20% of relationships are on equal footing.
.png?width=2100&height=238&name=fig03%20(1).png)
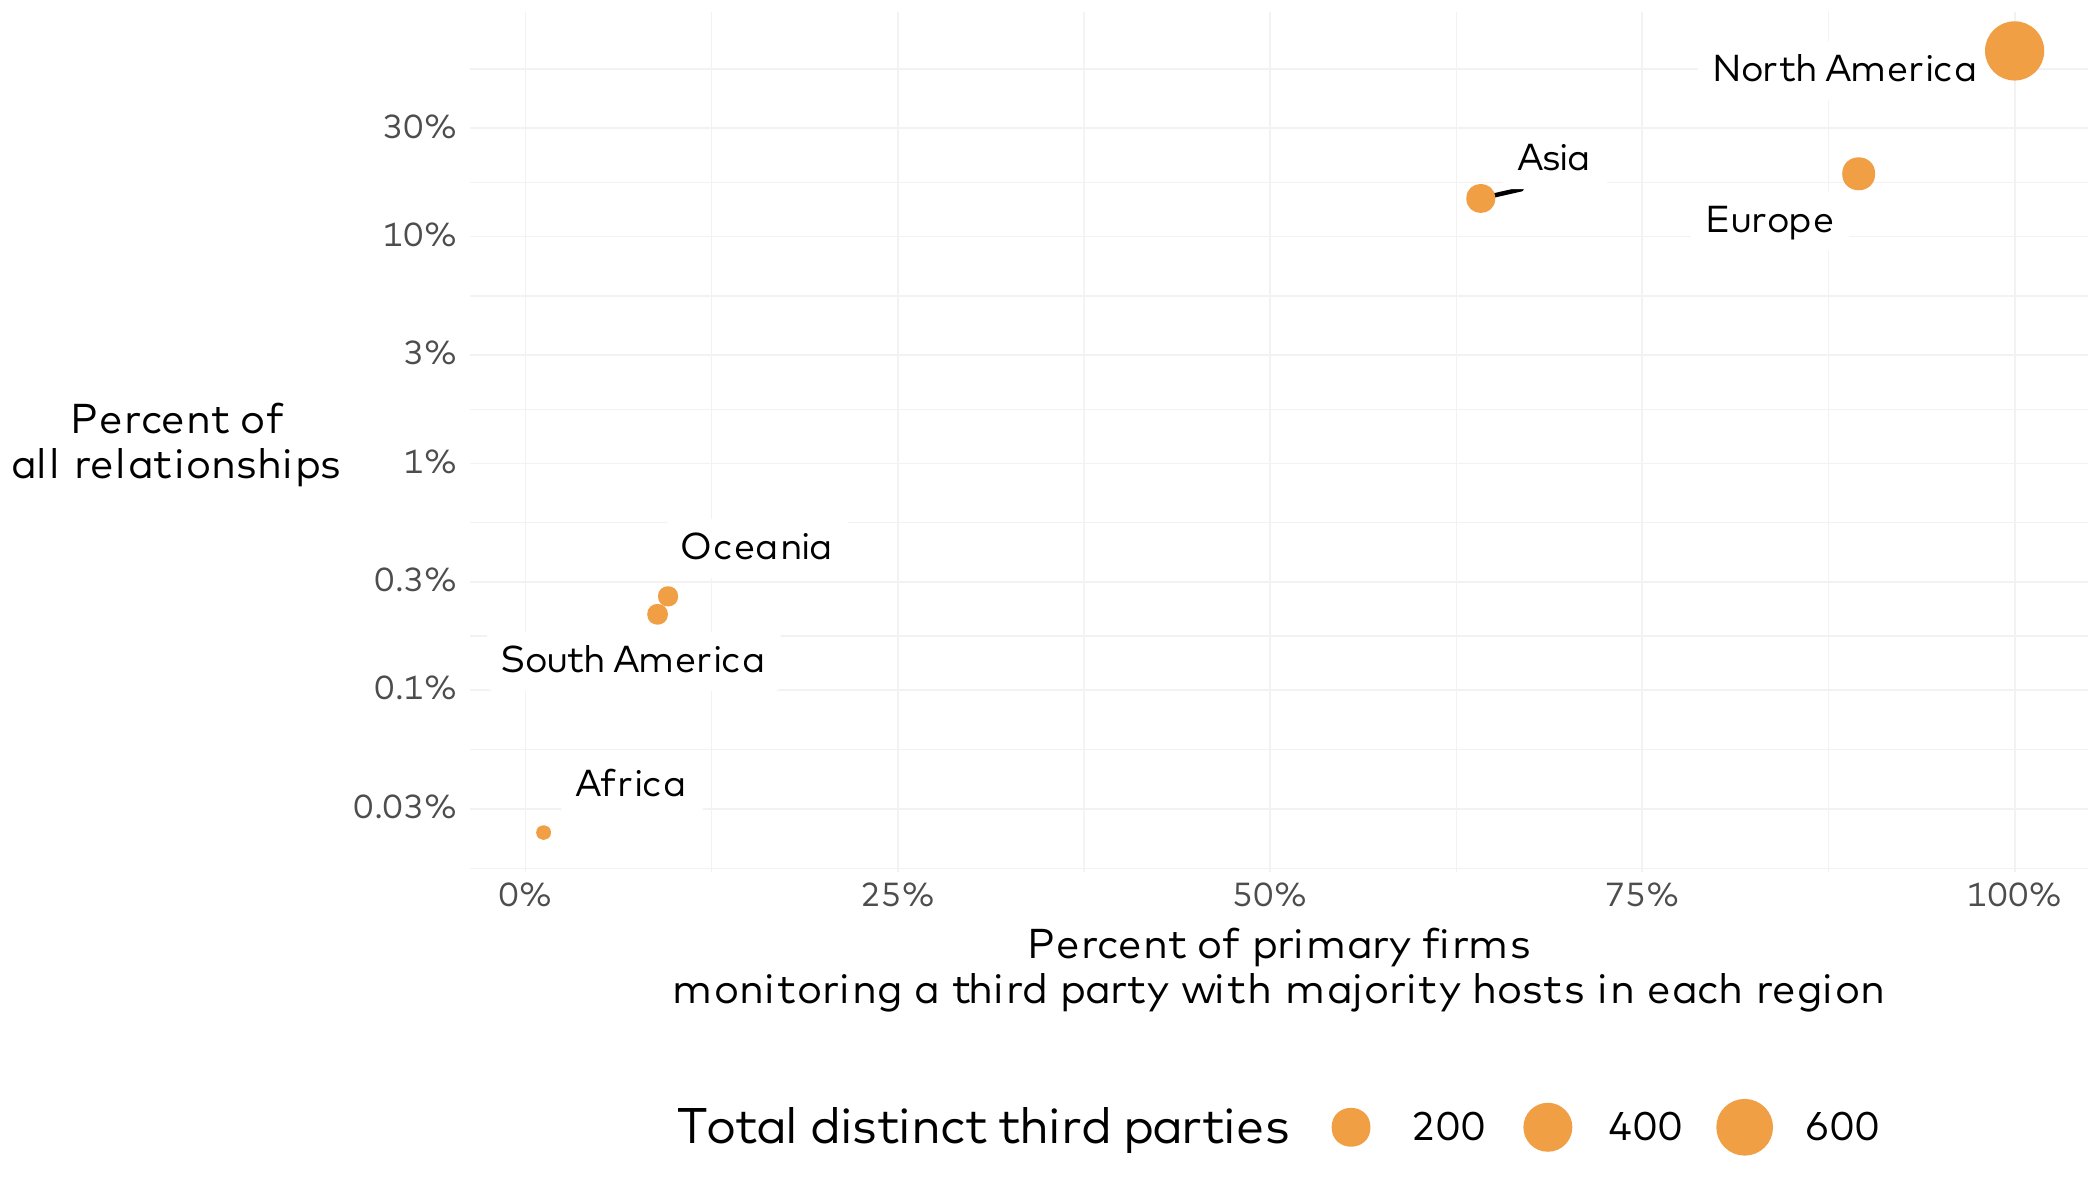
We’ll take a look at one last firmographic dimension before closing out this section—the geographic region of third parties. Since we measured size based on digital footprint, we’ll stick with that approach here...with a twist. Many organizations have systems in multiple regions, so we’ve elected to assign the region based on where the majority of hosts are located.
The horizontal axis in the graphic below shows the percentage of primary organizations monitoring third parties with a majority of hosts in each global region. Keep in mind that these are not mutually exclusive. Just about all organizations have at least one vendor with hosts in North America in their portfolio, followed by Europe (~90%) and Asia (~65%).
On the vertical axis, we show the percentage of all relationships represented by third parties in each region. The ordering is mostly the same, but the percentages are lower. A little over 35% of relationships involve a vendor in North America, while less than 0.03% hail from Africa. The size of the dots is relative to the unique number of third parties in each region.
You can download the full report here to get access to all of the key learnings from our research. Additionally, if you would like to gain insight into the cybersecurity hygiene of the vendors in your ecosystem, you can get a free 30-day trial of the RiskRecon platform.
Stay tuned for the next piece in our blog series on Balancing Third-Party Risk.