In part two of our blog series on predicting cyber risk posture, we dive into more advanced models of third-party risk assessments to determine how valuable a partial and full range of technical details are for understanding how risky a vendor is. In case you missed part one of this blog, you can view it here.
Let's look at these two advanced scenarios now.
SCENARIO 3: HOSTING PROFILE
Let’s give our third-party risk manager access to additional information about the external hosting profile of a vendor. Whether through an initial onboarding process or some additional investigation, there’s now visibility into risk factors like the geographic distribution of hosts, the proportion of hosts running sensitive or critical functions, and the allocation of hosts across on-prem vs. cloud environments.
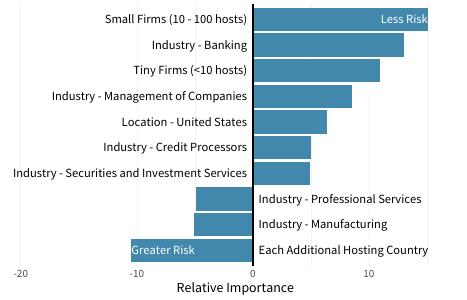
Adding these hosting elements to the existing firmographic factors and constructing a new model based on both change a few things, but don’t change the overall outcome very much. There’s still justification for revising risk assessments down for financial services firms and up a bit for professional services and manufacturers. Interestingly, we now begin to see some differentiation with organization size. Small and tiny firms still appear less risky (for now).
Specific to the new hosting variables, only the number of hosting countries shows up as an important new variable. Even though the new factors don’t make a huge difference in the final outcome, they are still significant in the model by how they influence pre-existing factors. Notice how the importance of being located in India disappears as a determinant of risk. This is not surprising as country has many of the same characteristics as industry – lots of variation of risk in the aggregate, but not necessarily predictive at the individual firm level.
These shifting variables don’t change much about the predictive power of this model. The R2 statistic barely nudges up to 5.2%, so our third-party risk manager still faces a huge amount of uncertainty in trying to separate the wheat from the chaff across the vendor portfolio. We’ll give it one more try to build a better model that offers some actionable insight.
SCENARIO 4: FULL TECHNICAL INSIGHT
In this final scenario, we assume that our third-party risk manager now has access to the full suite of RiskRecon cybersecurity ratings and insights. This includes all the firmographic and infrastructure dimensions of previous models plus detailed reporting on the volume and variety of security issues discovered by RiskRecon across Internet-facing hosts. Such issues include the presence of exposed network services, unpatched software vulnerabilities, configuration, and authentication problems, and other findings falling under the categories shown below.
In this new high-fidelity model show in the figure below, we see a radical shift in what matters most. Things that drove the perception of vendor risk in prior models, such as industry and primary country, now become largely irrelevant. Even cloud adoption and geographic distribution of hosts don’t contribute much to our understanding of risk. How organizations manage the security of their infrastructure—wherever it’s located—has a much stronger effect on vendor risk posture.
This doesn’t mean that the primary country isn’t an important risk factor. It simply means physical geography isn’t nearly as important when you have detailed insight into actual security findings. In other words, it would not be wise to say, “this vendor has a ton of security findings but they’re a U.S. software firm, so we’ll give them a pass.” Bottom line: What you do is a much bigger determinant of risk than who you are.
It’s curious that a smaller firm size predicts greater risk in the graph below but indicated less risk in the earlier scenarios. That’s a common occurrence in models and decision-making in general. As new information comes to light, the old information is reassessed and potentially weighted differently than before. Specific to this model, once you know what’s really going on with security findings, you have more clarity on how size and other firmographics actually impact risk.
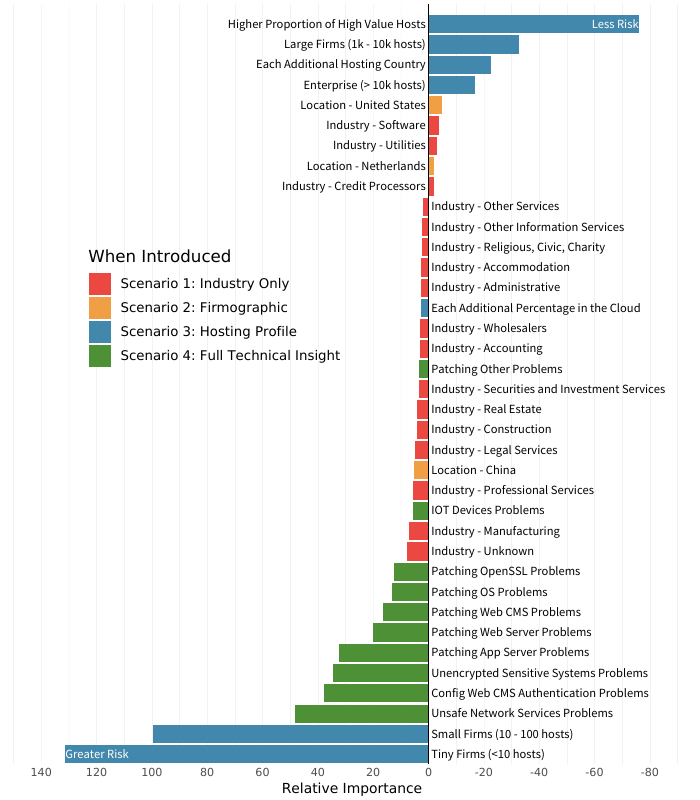
Even with that explanation, the huge relative importance of organization size in this “Everything Model” is rather hard to process. Our best interpretation of what’s going on here is that once we have a proper assessment of security-related issues, organization size (which often correlates with resources) becomes a major predictor of a vendor’s ability to address those issues. According to the data underlying this model, smaller firms tend to struggle to fix security issues, whereas larger enterprises—even though they often have more findings—are able to mitigate them in a timely manner.
With respect to the various types of security findings assessed, exposing unsafe network services proved to be the strongest single predictor of risk posture. That’s rather serendipitous because we published an entire report detailing the prevalence and effect of such services. What we see here echoes what we learned there: organizations that tend to be laxer in controlling unsafe services also tend to exhibit wider security issues.
We won’t elaborate on all of the remaining findings individually but suffice it to say that validating vendor security hygiene using factors like those shown in green in Figure 9 goes a long way toward building a proper understanding of their risk posture. These technical insights provide a focusing lens so that other information, such as firmographics, can be used with greater power and precision. It’s easy to answer “Yes” to a questionnaire asking whether all systems and applications are updated. But it’s not so easy to bluff when the cards are face-up on the table.
COMPARING PREDICTION MODELS
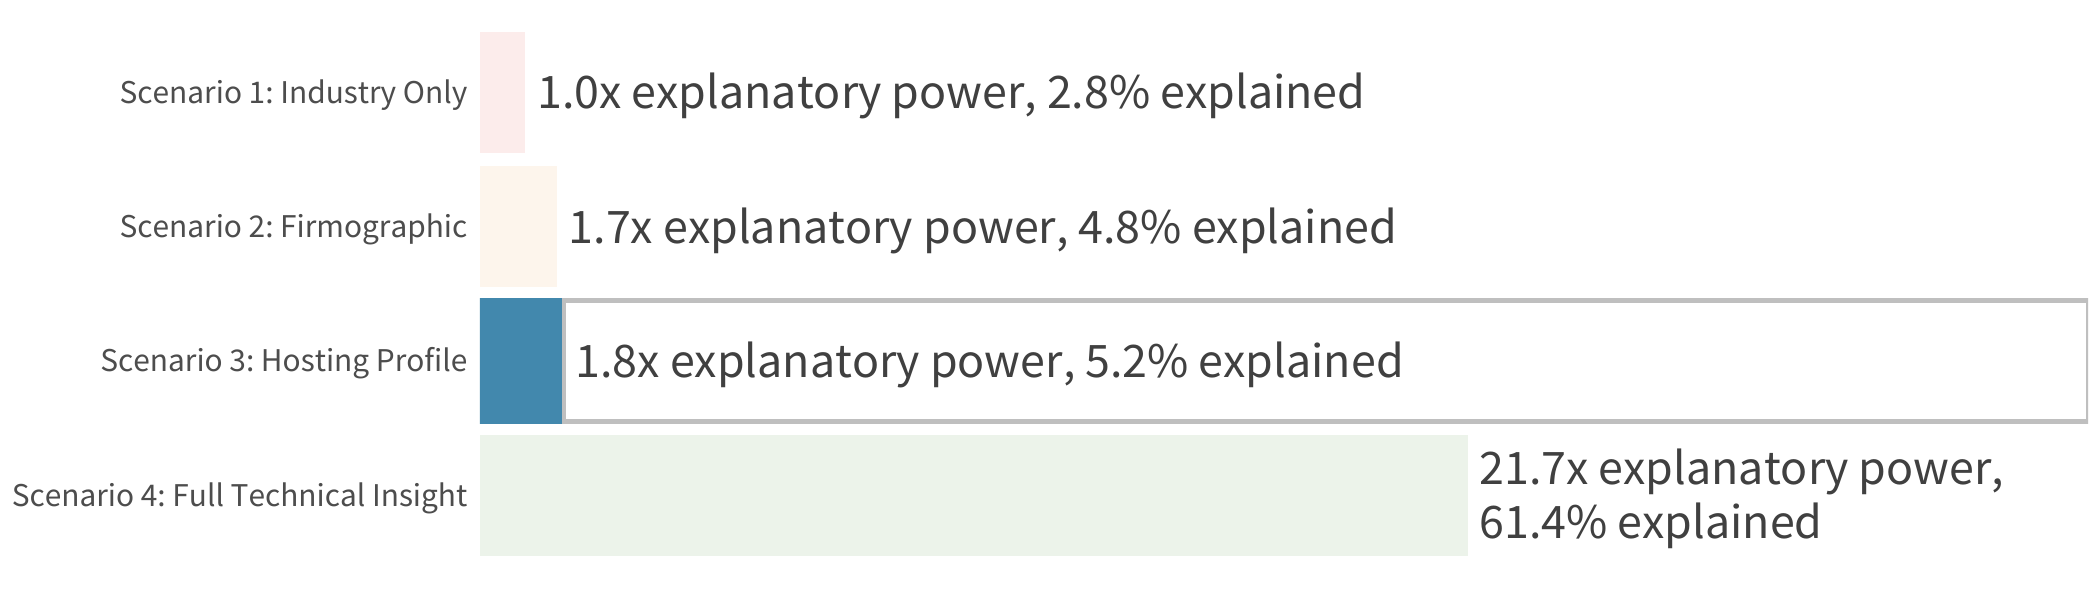
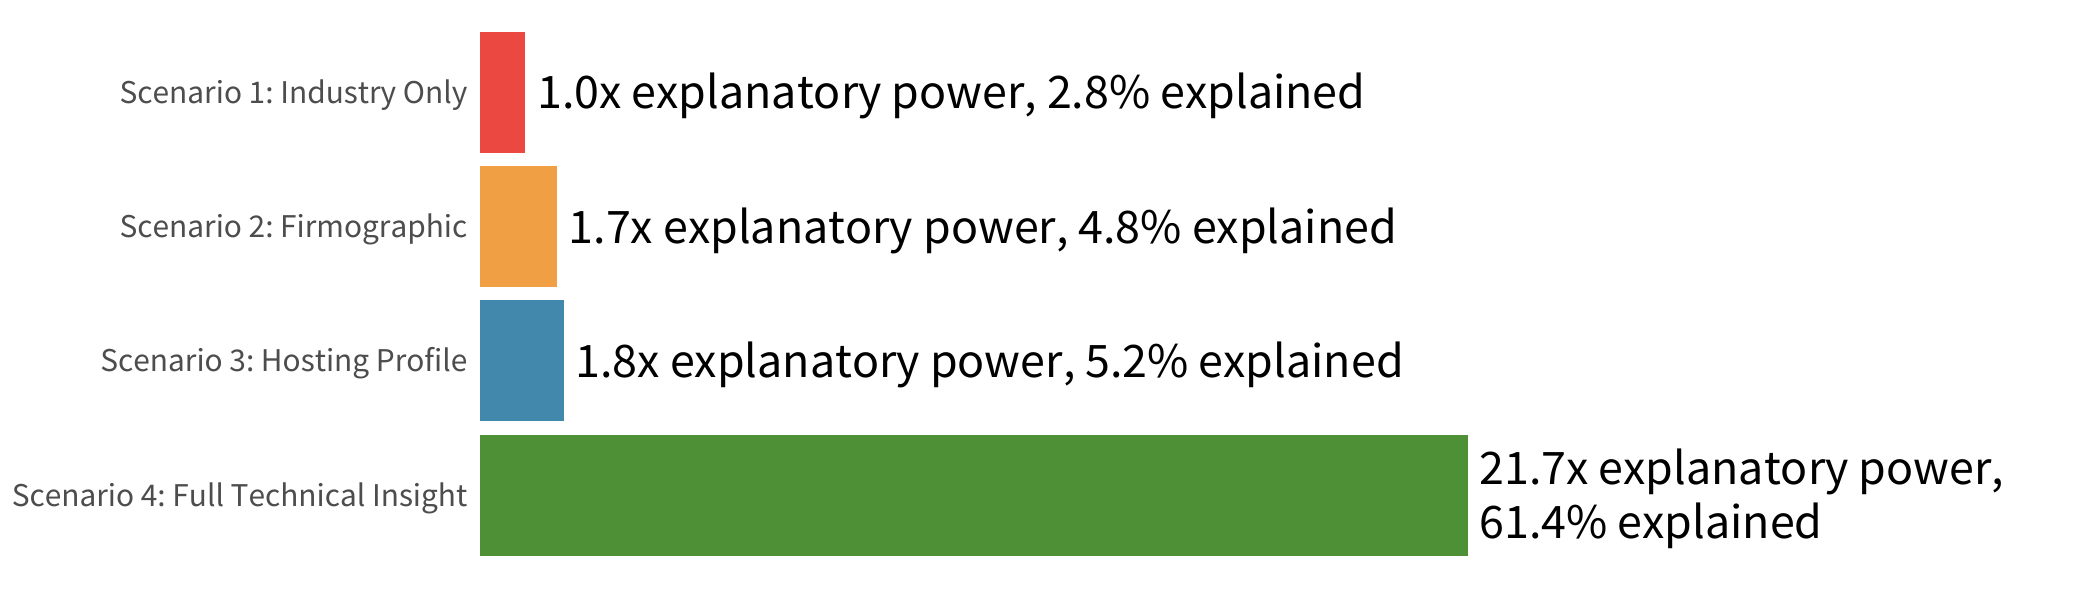
More important than any individual contributing factor is the overall strength of this model. The proof, as they say, is in the pudding. To that end, Figure 10 offers a blind taste test to see which pudding model works best for predicting vendor risk.
Recall that our firmographic model posted an R2 of 0.048. Adding the infrastructure variables nudged that up to 0.052. To put that into perspective, imagine trying to make a critical life decision if you knew just 5% of the things that would ultimately spell success or disaster. Not very helpful, right?
Well, thankfully, having visibility into the security posture of a vendor’s systems is a lot more helpful in making good decisions. The ‘full technical insight’ model discussed in the previous section achieved an R2 of 0.614. That’s nearly 22 times more effective for diagnosing vendor risk posture than relying on industry information alone!
We now come full circle to the chart from the beginning of this report. We trust that you can now see the ineffectiveness of the first three scenarios when it comes to determining a prospective partners risk surface.
 Download our Uncertainty to Understanding report to get the full details of our research.
.png)