


In this blog post, we will discuss how we are seeking to predict third-party cyber risk posture from our recent research report, Uncertainty to Understanding.
With our measure of risk posture defined and normalized in a previous blog post, we can get down to the business of finding the factors that provide a reliable signal of an organization’s cyber risk posture. To make this more than an impersonal analytical exercise, we’ve decided to simulate decision scenarios that will be familiar to most readers by attempting to figure out which vendors are more likely to pose cause trouble in the form of cyber incidents and losses.
– Scenario 1: Industry only
– Scenario 2: Basic firmographics
– Scenario 3: Hosting profile
– Scenario 4: Full technical insight
We begin with two trivial scenarios where only very basic firmographic information is available on which to base third-party risk assessments. The third scenario adds some additional information about the vendor’s IT infrastructure to (hopefully) better peg risky vendors. Our final scenario incorporates the full technical details available in RiskRecon’s continuous monitoring dataset to support decision making.
For each scenario, we built a predictive model using the risk posture measure described above as our dependent (outcome) variable. Factors included in each scenario/model are described below, along with the strength of their contribution (or lack thereof) to the predictive model. We’ll assess each model’s performance individually and show how each step up in information increases our ability to make better decisions.
SCENARIO 1: INDUSTRY ONLY
Let’s first revisit a key finding from our Internet Risk Surface Report. In that report, we demonstrated that industries have different levels of risk exposure in the aggregate. A busy TPRM professional may be tempted to lump firms into risk categories based on their industry. This ‘Industry-Only’ determination is our first scenario.
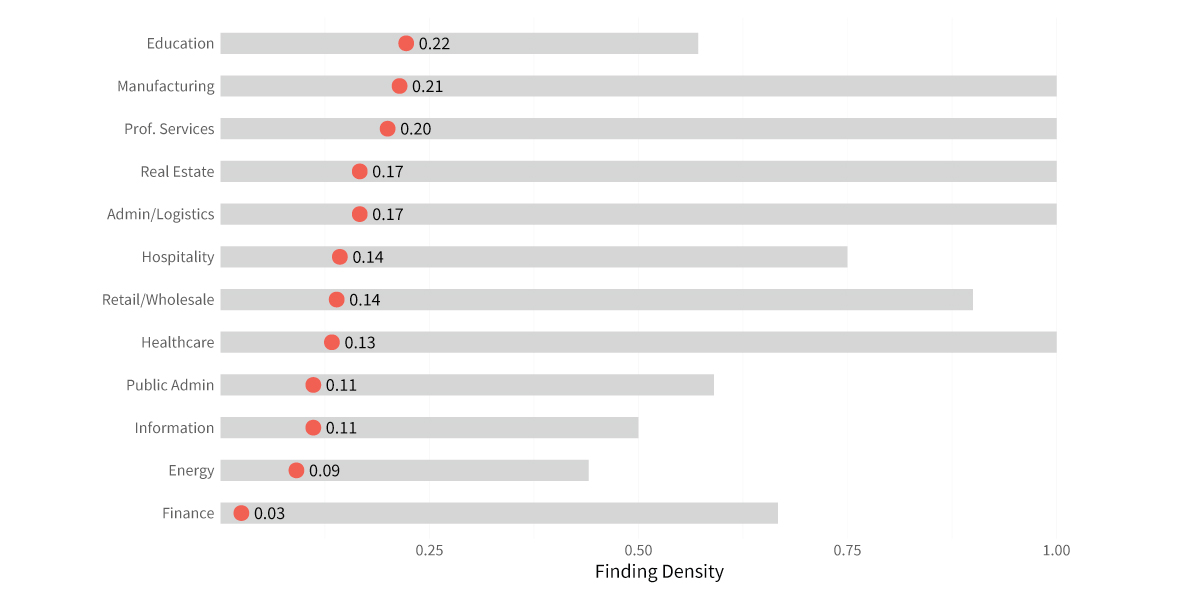
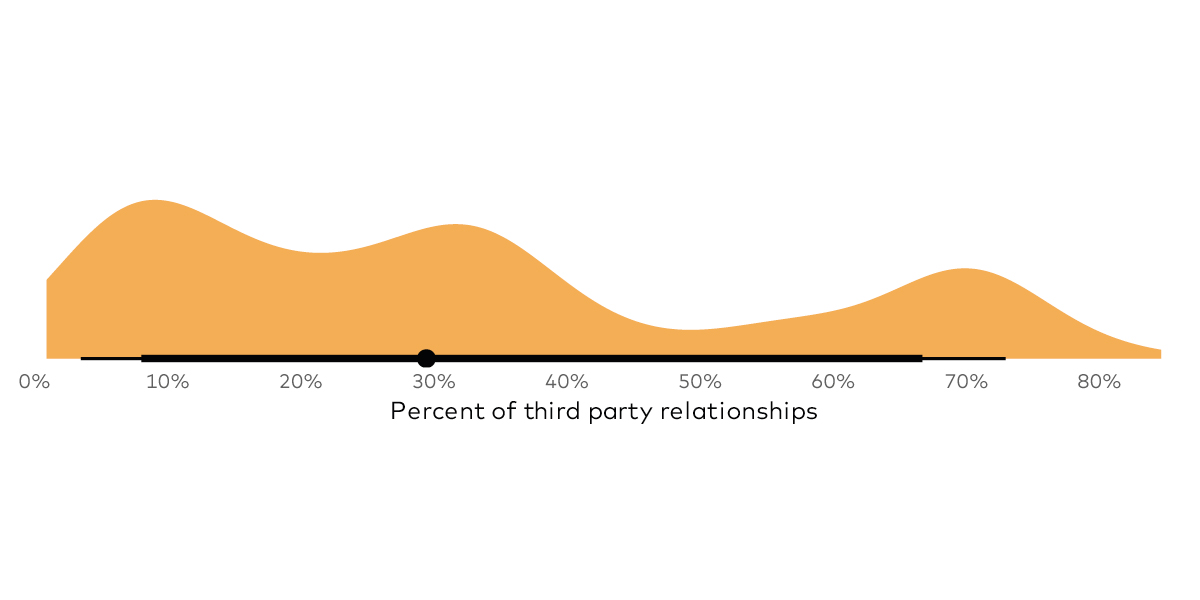
An immediate practical problem with this approach is that it’s rare that an organization can decide between doing business with a firm in, for example, the hospitality industry versus one in the energy sector. While industries differ in a broad population, risk practitioners need to decide between a number of different individual firms to help their organization carry out their business functions. And at the individual firm level, there is a lot of variation between the best and worst performers in each industry. In Figure 3 below, we show the median density of severe findings among high-value assets for each industry. We also display the range of finding densities found across firms in each industry, showing two-thirds of the overall spread.
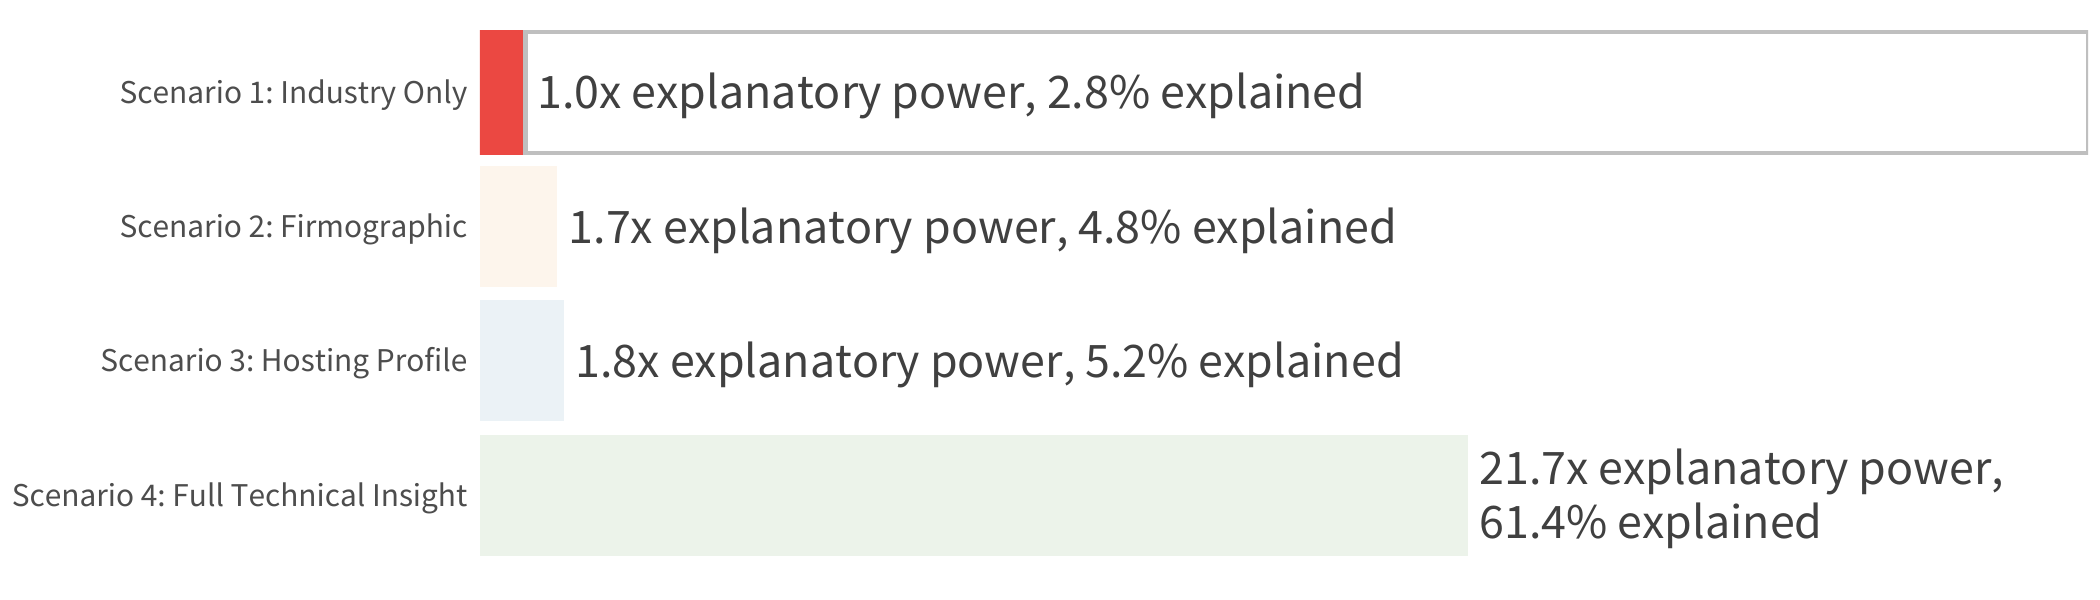
Notice how the dot indicating the median is clearly different in the chart below, but the bars showing the range of common values for individual firms overlap. This tells us that, in general, the education sector tends to have a worse risk posture than the finance sector, but many individual financial firms are equally or riskier than educational institutions. More rigorously, a risk manager using only industry to determine the risk of an individual firm can only explain 2.8% of the variation among all the firms. Thus, this model results in extremely unreliable predictions (yet we often hear and cringe - of organizations using industry as the primary variable in their risk assessments and models).
It is clear a model that can only explain 2.8% of what determines a firm’s risk posture isn’t one we’d suggest anyone seriously employ. But it’s a simple demonstration of the problems of trying to zoom in to the potential risk of a specific firm. This problem continues even as we try to add more information and build up to a more realistic model.
 SCENARIO 2: BASIC FIRMOGRAPHICS
In our second scenario, we expand beyond industry but still limit our third-party risk manager to only basic firmographic elements about vendors, namely industry, organization size, and primary country of operation. This information is readily available prior to any kind of technical assessment. On a small scale, these data points can be gleaned simply by knowing the company. On a larger scale (i.e., across an entire vendor portfolio), services like Dun & Bradstreet and Hoovers supply this level of information.
Features used:
- Industry (industry as used in scenario 1)
- Organization Size (size of the organization measured by the number of visible hosts)
- Primary Country (majority of country Internet presence)
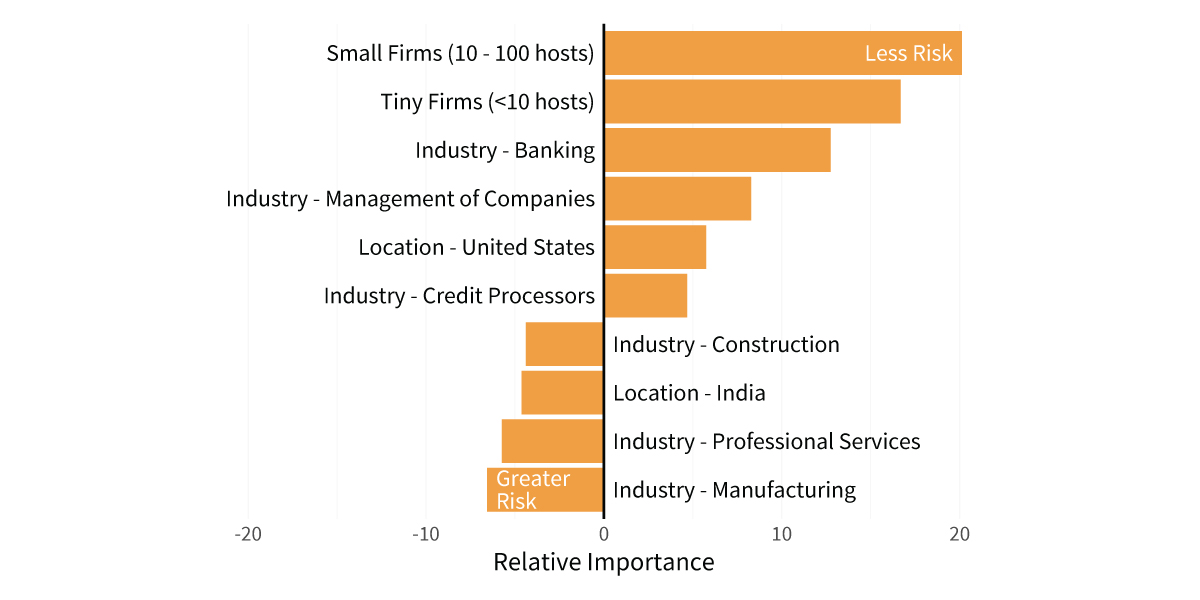
Using this information, we re-constructed our model using our risk posture proxy of the density of high and critical findings on high-value assets as the outcome variable. The chart below shows the firmographics that have the greatest effect on risk posture predictions and whether they indicate lower risk (extending to the right) or higher risk (extending to the left).
These results give our third-party risk professional some basis for considering manufacturing firms based in India as more “risky” and thus deserving of more attention. Conversely, there’s evidence that firms in the banking sector, as well as those located in the United States, might be reasonably deprioritized if time or resources are limited.
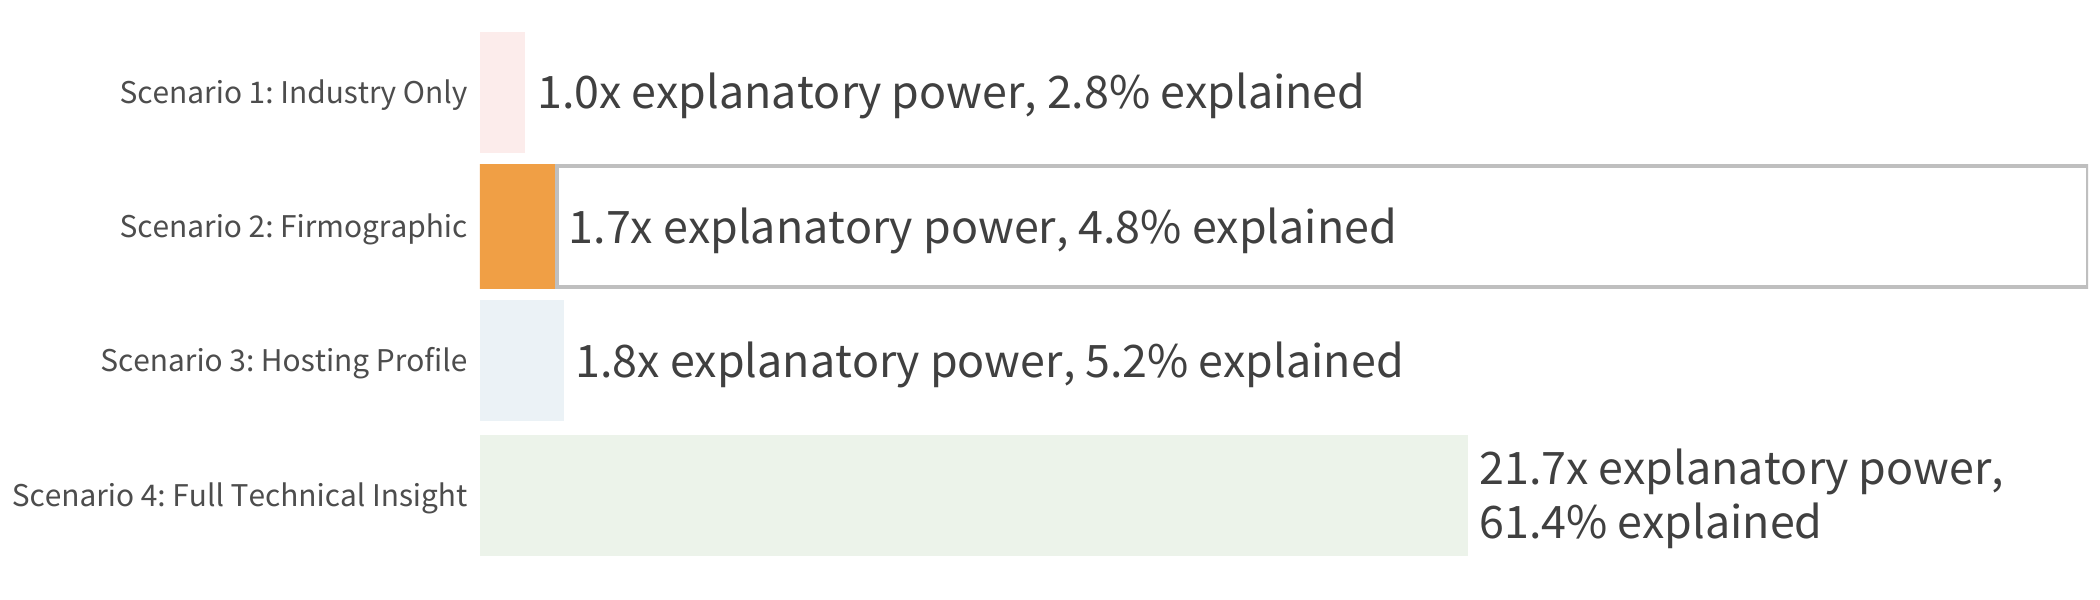
In conclusion, the overall predictive strength of the ‘Firmographic Only’ model is quite weak. The R2 is less than 4.8%, indicating firmographics alone explain less than five percent of the variation in a firm’s risk posture. That’s not very helpful to third-party risk practitioners needing reliable insight. Practically, that means the chance of misjudging the potential risk associated with vendors (and thus mis-assigning control requirements) is very high. Let’s see how we can improve our odds by feeding more information into the model, which we will discuss in our next blog.
 Download our Uncertainty to Understanding report to get the full details of our research.
.png)
