As we started to dive into our research on how firms are managing their internet risk surface exposure, we first sought to identify what separates the top and bottom performers and decided to define what “top” and “bottom” mean. How do we place any given organization in one category or the other? While business performance metrics abound, here we’re focused solely on how well organizations manage their cybersecurity posture. Our primary measure for well-performing organizations is the same as used in our Uncertainty to Understanding report, i.e., high-risk findings density.
We used a large sample of data from RiskRecon, filtering it down to organizations that have at least 50 active hosts. This means that this sample represents significantly sized firms to help shift our focus to organizations with not only a more prominent digital footprint but also those that were more likely to be candidates for enterprise-level partners. We then identified organizations with the highest and lowest proportion of high-risk findings density. The top performers, which are the organizations with the lowest finding density, caused a little wrinkle for us since many of these organizations had no findings. Thus, the top performers considered for the present purpose have a high-risk finding density of zero as well as a RiskRecon score of A.
HIGH-RISK FINDINGS DENSITY
In a perfect world, third-party risk managers would be able to accurately and continually assess the expected losses associated with each vendor in their supply chain using perfect information. Sadly, that is not our reality. What we do have is a reasonable proxy for organizational cyber risk posture that meets the needs of both this analysis and, more to the point, risk managers.
While it’s true that firms with strong security defenses can still suffer major losses (and those with weak defenses may, through luck, squeak by without experiencing any), experience shows that firms that manage risk well perform better over the long term. Thus, we use the density of high and critical security findings that affect high-value assets as a measurable proxy for organizational cyber risk posture. This incorporates the following two key dimensions from RiskRecon’s dataset:
Issue Severity - Detection of security-relevant issues that expose hosts to various threats. We focus on findings that are rated high or critical according to RiskRecon’s categorization.
Asset Value - Relative sensitivity and criticality of hosts based on multiple indicators. We focus on high-value assets, which collect sensitive data, authenticate users, run critical services, etc.
This approach is consistently reinforced by our research with RiskRecon. For example, our investigation of Internet of Things (IoT) devices from 2020, found a jump of 70 times concerning critical security issues in high-value assets among organizations that expose vulnerable IoT devices to the internet when compared with those that do not. Those organizations that cannot manage the critical security issues affecting their most valuable assets are almost certainly struggling with many other aspects of managing their cyber risk posture as well.
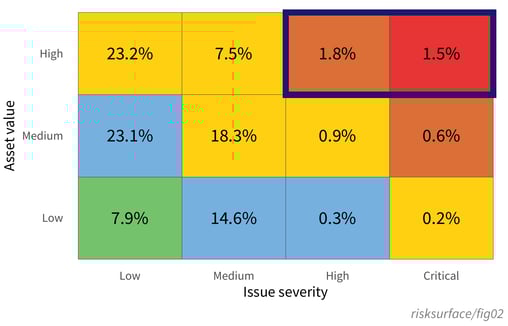 Figure 1 reveals the overall percent of findings that fall in each segment of the risk prioritization of RiskRecon, by comparing the severity of an issue with the importance of the asset on which it exists. Overall, there are relatively fewer findings when we look at the upper right, which are our high-value assets with critical issues. Organizations seem to be doing a pretty decent job at prioritizing the riskiest findings overall. However, we don’t deal with “overall” in 3rd party risk management. We deal with specific organizations and their specific risks.
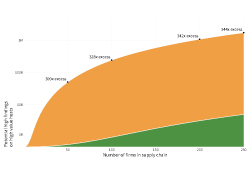
Given that we are defining top performers as organizations that have zero findings and a RiskRecon score of A, and we have identified bottom performers as organizations with the most amount of high-risk finding density, we can take a quick look at Figure 2 to see the results of this categorization.
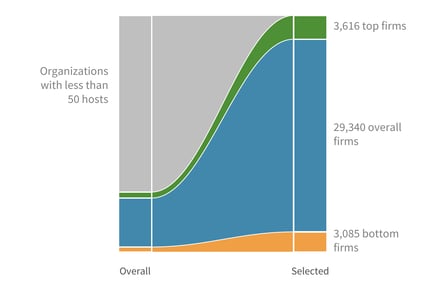 The left column shows the overall scope, with the gray part representing those organizations with less than 50 hosts. The column on the right narrows our focus down to the organizations present within the slices that were focused on and are discussed in this report. While focusing on the endcaps, the overall number will sometimes be used as a point of comparison.
However, the question remains, do we see an obvious difference among organizations when it comes to the Risk Prioritization Matrix?
Let’s take a look at Figure 3.
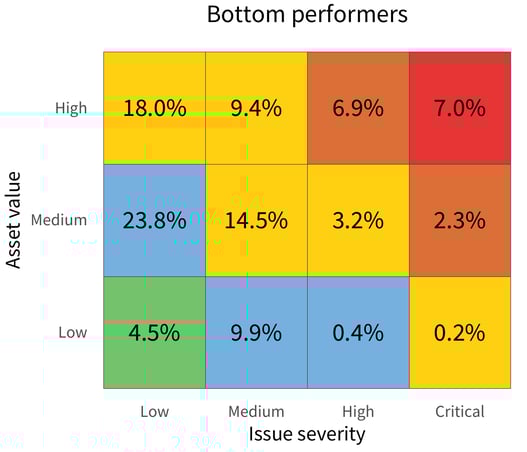
In Figure 3, the top Risk Prioritization Matrix shows the state of issues across the bottom-performing organizations.
Looking back at the first version of this matrix in Figure 1, it’s clear that these organizations have a higher-than-normal proportion of findings in the high, critical, and generally risky upper-right area of the matrix.
The fact that they have more critical findings on high-value assets than low-severity issues on low-value assets is concerning. If your organization partners with a bottom performer and the business relationship involving your data being stored, processed, or otherwise reliant on these systems, then you have cause for concern.
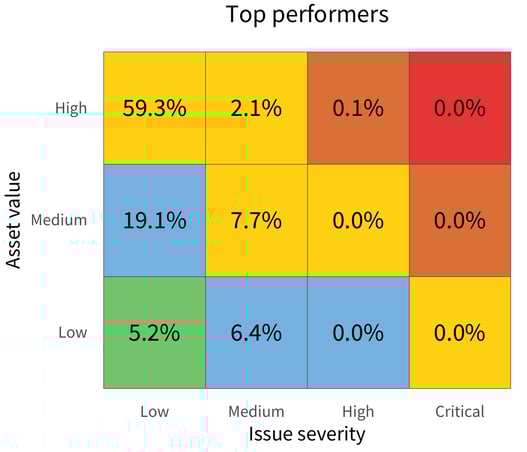
Conversely, in the lower matrix of Figure 3, the top performers appear to be doing a substantially better job at minimizing high-risk issues, with 0% in the high-value and high-severity corner. Gold star!
Although security isn’t the only decision criterion that you should be focused on when selecting third-party providers, it is an important one. From these matrices alone, there is a strong case for favoring a top-tier partner over a bottom one. So, can we get to the root of exactly what it is that makes a bottom performer act differently from a top performer?
Download the full report here to see how you can understand and navigate the internet risk surface safely.