During this blog post, we examine how a couple of factors - cloud adoption rate and technology footprint - impact an organization's risk surface.
Let’s first examine how organizations are adopting the cloud. Right off the bat, we notice that many industries are just about to, or very close to, shifting majority cloud, which is an amazing shift in the balance of host locations over the years. We can also see that the industry bookends Education and Real Estate, which shows how cloud readiness, along with their adoption rates, may start to create a clearer picture of what differentiates a top and bottom performer. Again, this is not to say that the best in Education is not doing better than the worst in Real Estate.
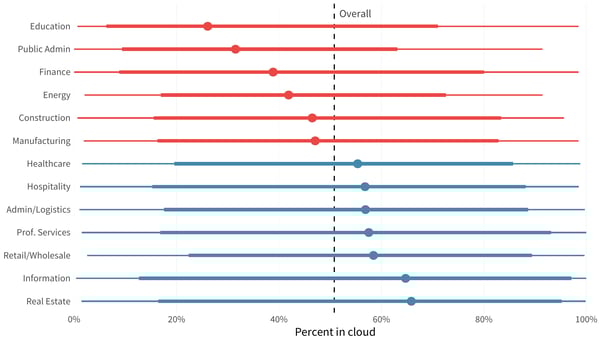 The chart below shows the drastic variation in cloud adoption per industry. For example, it’s no surprise that the Information industry would be a majority cloud industry, with 90% of its top performers choosing to use the cloud to host their assets.
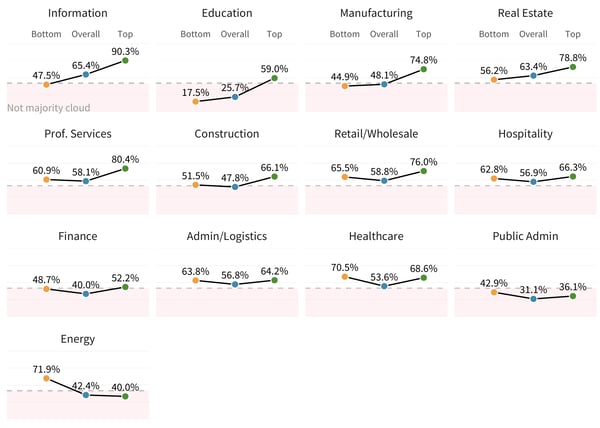
Education, on the other hand, has an extremely low adoption, with only its top performers breaking the barrier to being majority cloud hosted. Finance is interesting, because the bottom and top performers are just, ever so slightly, on the opposite sides of the majority cloud market. It could be due to the varying regulations and industry standards that partners in the financial industry must always comply with, but it is something to note.
Information seems to be the clear leader in cloud adoption, which highlights how far behind the rest of the industries are when it comes to shifting toward cloud partners.
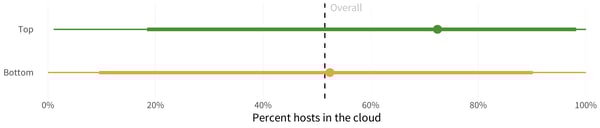
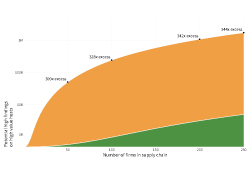
When we look at the cloud adoption rates of the top and bottom performers, we start to see some very clear separation. There is a clear gap between the top and bottom performers when we look at the graph. Every 10% increase in host cloud concentration, results in a 2.5% increase in the probability of being a top performer.
We can now clearly see that the top performers are more likely to have hosts in the cloud. However, what difference does it make if the best of the bottom performers are still better than the worst of the top performers?
It makes a BIG difference.
First off, we can see that choosing a cloud is way less important than deciding to go cloud-first. The data tells a big story, because when an organization decides to be cloud-first with a single provider they have, on average, a nearly 85% higher chance of being a top performer. So, does who you choose to go with matter? Choosing to go majority cloud with one of the ‘big three’ cloud providers, namely AWS, Azure, or GCP, has inconsequential effects rather than being simply cloud-first. Being in the 'big three' of cloud providers may have other advantages; however, moving to a cloud-first approach has the largest impact on whether a partner can be considered a top or bottom performer.
So, if the cloud has such a big impact on determining whether a partner is a top or bottom performer, then does the tech footprint of an organization also have an impact?
TECH FOOTPRINT
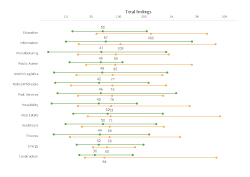
When we talk about the technological footprint of an organization, we are referring to how many different technologies are in use. We’ll dive into the specific technologies later, but let’s look at whether the sheer number of technologies used influences what makes a top or bottom performer.
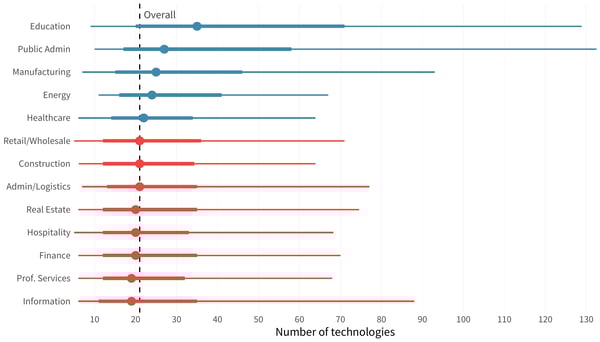
Education sits high on the list, with the greatest number of technologies in play, which is no surprise, while Finance, Professional Services, and Information are at the bottom. Industries like Finance rely heavily on regulated technologies, processes, and compliance standards to help minimize their risk. So, it comes as no surprise that industries that have a lot of regulation around them would have a smaller technical footprint. Seeing Energy and Manufacturing high up may, at first glance, be surprising. However, they have a very wide breadth of organization types and verticals within them, which may account for the range in the technical footprint size.
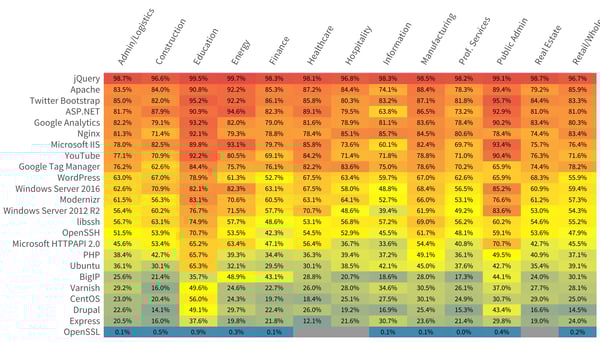
The top-25 technologies per industry are impressive, with jQuery heavily favored across the board. However, we can see some variation in use. For instance, PHP’s largest presence is in Manufacturing and Information, while Ubuntu is being used primarily in Education. Apache is still being used heavily across the board, i.e., between 74.1 and 90.8%, across all industries. OpenSSL, on the other hand, shows up as less than a percentage across the board.
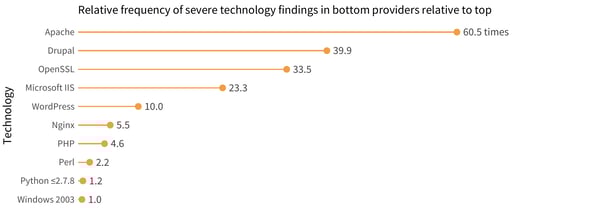 Just because an organization has a bigger technological footprint, it doesn’t necessarily mean that it’s a more problematic footprint. So, we took a look at the top problematic technologies of bottom performers.
While looking at the percentage of severe instances against certain problematic technologies, findings around Apache are 60.5 times more frequent in bottom performers than they are in top performers. Drupal and OpenSSL round out the top three technologies that carry severe technological findings in bottom performers.
SO, WHAT DOES THIS MEAN?
This means that when you are evaluating a potential partner organization, take the time to learn more about their technological footprint and the kind of technologies they use. Taking the opportunity to chat about patching processes or cyber hygiene practices can help you make a better-informed risk-posture assessment.
Download the full report here to see how you can understand and navigate the internet risk surface safely.