In this article, we continue our look a the key performance indicators from our recent study on how organizations are navigating the internet risk surface. We will look specifically at how asset count and value, along with geographic location impact the cybersecurity posture of a business.
Aside from the industry, the number of assets a company has, and how valuable they are, is another factor that’s often used to rank and stack third parties based on perceived risk. It’s also worth noting that there are differences of opinion on this. Is it easier to keep a smaller digital footprint tidy or is it that the higher budgets and resources of larger enterprises give them an advantage?
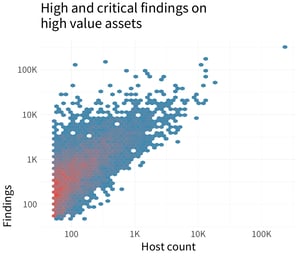
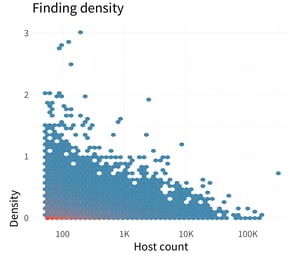
Buried in the mass of points on the image on the left here shows a slight negative relationship between the number of internet-facing hosts and the density of high-risk findings. This implies that more hosts seem to correlate with lower density, which makes sense: security issues become less saturated as the digital footprint grows
The chart on the right interjects a “yes, but” into the conversation. It shows that more hosts generally equate to more security issues overall. No shock there but this definitely is something to keep in mind.
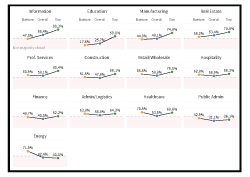
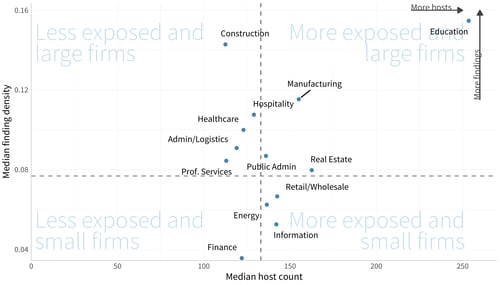 Before answering the question that started this section, let’s take a quick look at another graph. It offers an interesting view of industries based on their median density of findings and the median number of assets. The first thing we notice is the stereotypical separation between the sectors, Education and Finance. In the upper-right, educational institutions struggle to minimize security issues across a sprawling digital footprint. Whereas, financial institutions, with their regulation-motivated tight grip on assets, land (on average) on the opposite side.
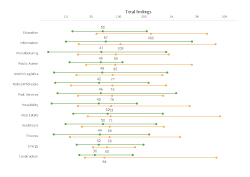
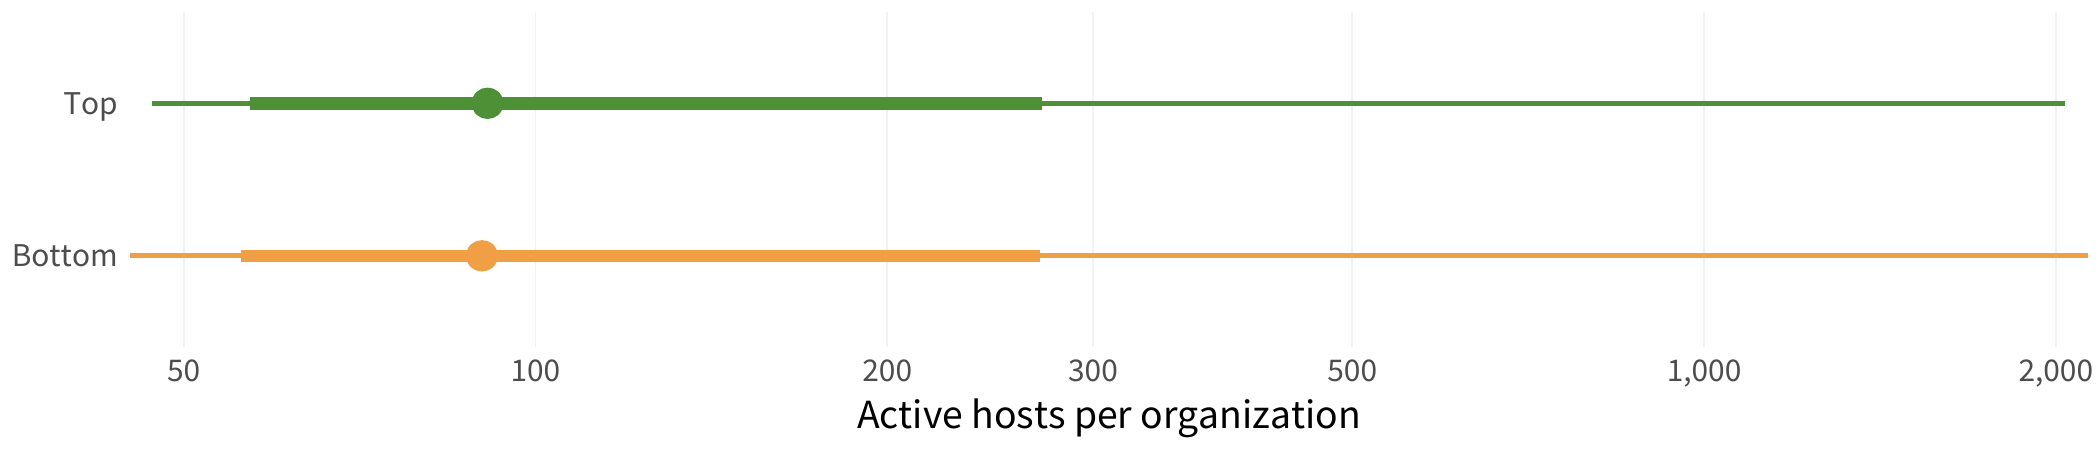
Now, back to the question at hand: Can we use the number of digital assets under management as a quick way to risk-rank organizations? The figure below answers this with a resounding “nope.” The top- and bottom-performing organizations have a nearly identical distribution of active hosts. And to be honest, that is surprising, especially in light of what we've discussed previously.
We love it when data surprises and corrects our intuition and implicit bias, which sometimes lead to uninformed decisions.
Let’s check one more risk surface dimension before leaving this section: asset value. If the raw number of hosts cannot differentiate between the top and bottom performers, then perhaps having a high proportion of assets that collect sensitive information, authenticate users, and run critical services might do the trick.
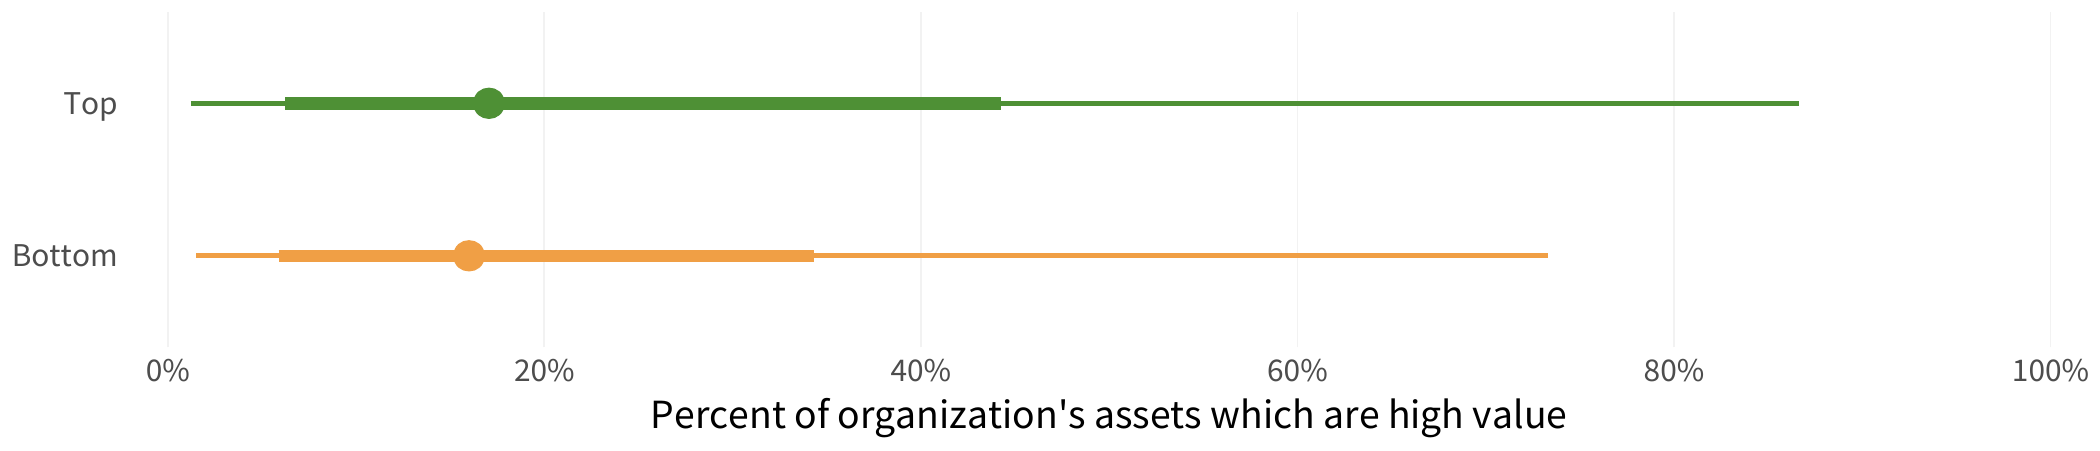
What is interesting here is that the proportion of high-value hosts does not seem to be a clear separator of the top and bottom performers. Not only is there an incredible amount of overlap, but the median is also nearly the same. As with host count, there is almost no discernible way to conclude that having more or less high-value hosts automatically makes an organization a top or bottom performer.
GEOGRAPHIC DISTRIBUTION OF HOSTS
The internet is often described as borderless, so it might seem a little odd to take a look at where the hosts are located. Although the virtual and physical worlds differ in many ways, different parts of the world have different policies, regulations, and customs that govern the hosts and data. Organizations with larger geographic footprints must manage a larger portfolio of geopolitical, legal, compliance, and physical risks tied to those geographies. As an indicator of such complexities, we examine the proportion of hosts located within and outside of a firm’s home country of operation.
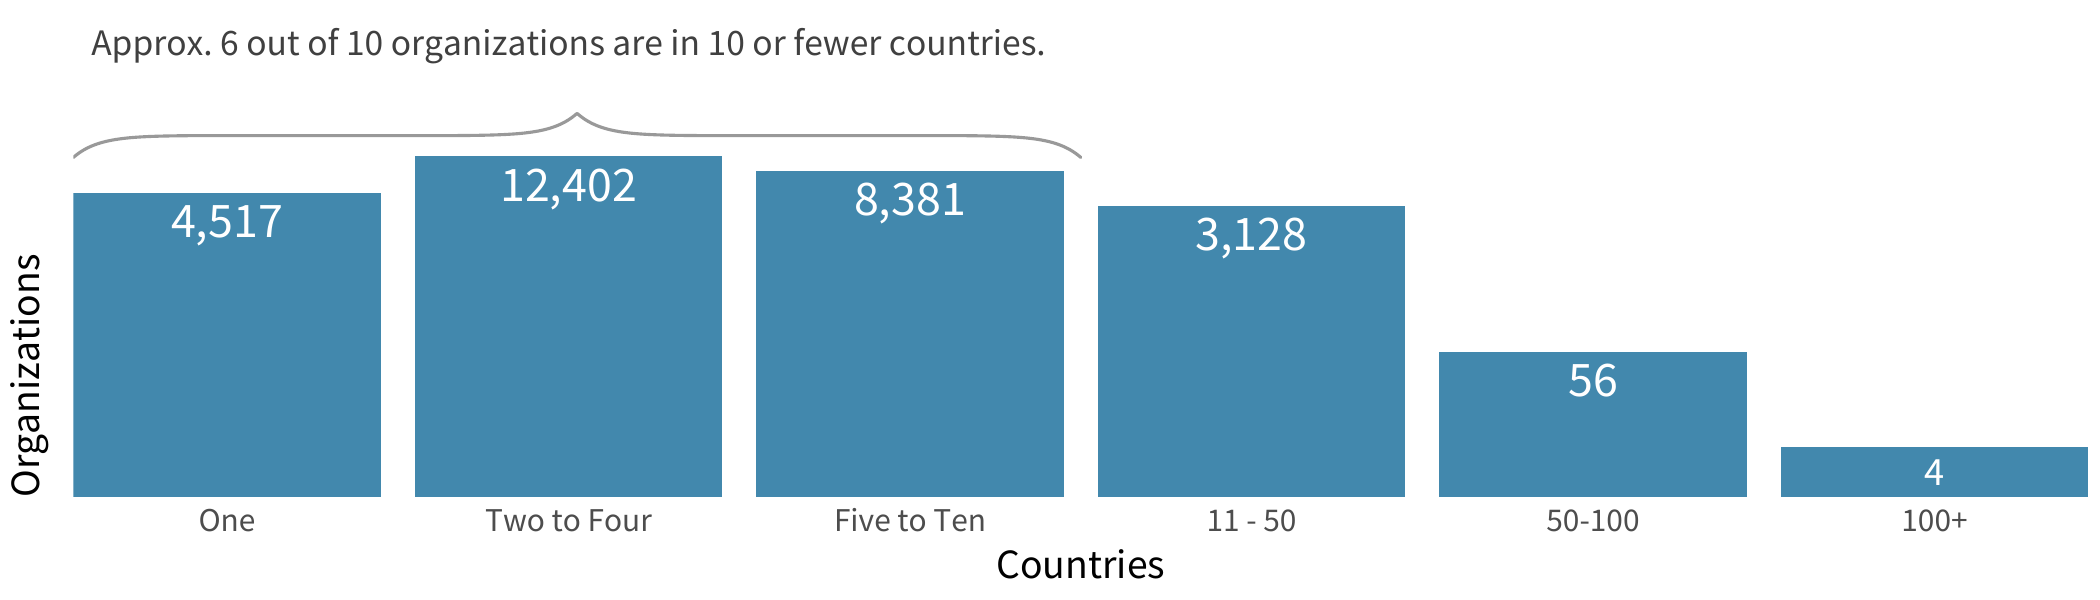
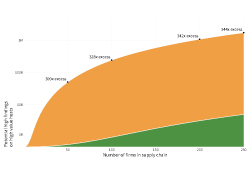
We see that approximately six out of 10 organizations have their hosts in 10 or fewer countries. This could simply be due to the size of the organization. However, whether a potential partner has hosts strewn across the globe or consolidated in a single country, the number of countries the hosts are located in doesn’t seem to be an indicator of their security posture.
 So, let’s dive a little deeper and look at the individual host country levels of high-value hosts against the top and bottom performers.
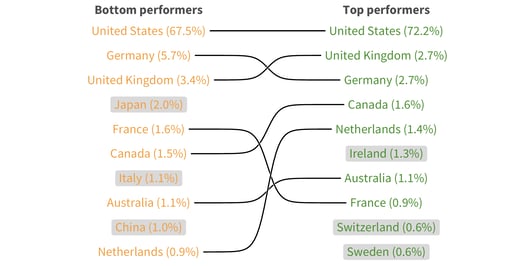
To clarify, when talking about host countries, we are looking at the primary country where the majority of a firm’s assets are located. The top three host countries are virtually the same for both top and bottom performers. 72.2% of top performers primarily have hosts within the United States, and 67.5% of bottom performers have hosts within the United States. We can also see that Germany makes up 2.7% of the top performers, but 5.7% of the bottom performers. France nearly doubles its relative ranking, from 0.9 at the top to 1.6% at the bottom.
What you might notice here is that there are certain countries that do not show up on both lists. Ireland, Switzerland, and Sweden are only represented in the top performers’ list. Whereas, Japan, Italy, and China are only represented in the bottom performers’ list.
So what does this actually mean? Are certain countries more or less secure than others? It looks like this can be answered with a “maybe.” Since the majority of top and bottom performers have hosts located within the United States, United Kingdom, and Germany, it’s hard to say. However, the fact that certain countries only show up on the bottom performers’ list may have to do more with the organization and upkeep of the hosts and assets than the hosts’ geographic location.
So, if geographic locations do not necessarily show a difference, then let’s look (up) at the next possible host location: the cloud.
Download the full report here to see how you can understand and navigate the internet risk surface safely.