Recently, RiskRecon and the Cyentia Institute launched a research report called, The State of Noncompliance in Cyber Risk, which aimed to understand which regulations related to third-party risk management are the toughest for firms to meet, and what parts of these standards are causing the most issues as seen by the RiskRecon platform. During a blog series that will be published out over the next few weeks, we will examine the details and points from that report, breaking things down in bite sized pieces.
While many standards overlap to a varying degree, every standard has a different number of security requirements associated with it. Our next analysis aims to uncover how the volume of requirements for each standard impacts the rate of noncompliance across our sample. This can help us gauge which standards are more difficult to achieve.
In the chart below, we take a look at the percentage of the requirements for each standard that are marked as noncompliant across different organizations. We see that GDPR is extremely uniform, ISO is largely problematic, while NIST CSF has the lowest amount of relative noncompliance.
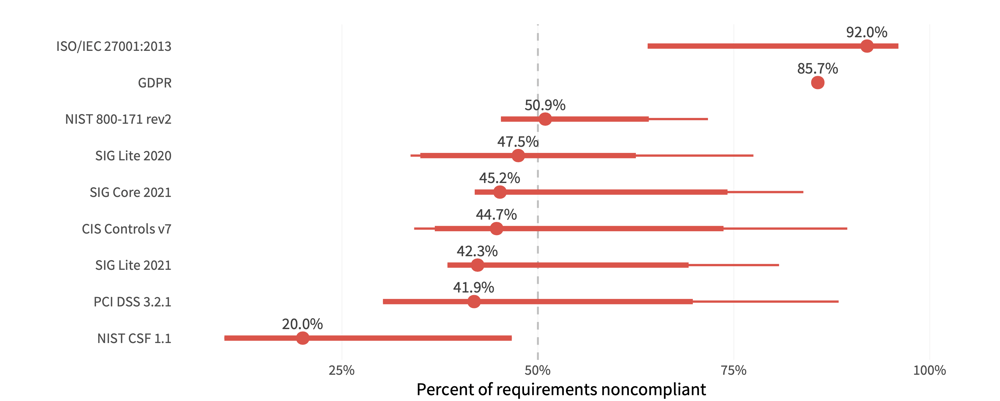
FIGURE 1: DISTRIBUTION OF NONCOMPLIANT REQUIREMENTS PER STANDARD
The median indicates the typical proportion of controls that aren’t being met. The full range of lines shows where most (50%) organizations fall. Looking at SIG Core 2021, we see that the typical organization has potential issues with just over 45% of these requirements, while 50% of organizations are somewhere between 42% to 71% potentially noncompliant. As is often the case, a single number is not a good measure for all firms.
Interestingly, the NIST Cybersecurity Framework (CSF) indicates the highest level of compliance among the standards shown here. We suspect that’s partly because its requirements are fairly broad, since it was designed more as a set of control guidelines, than a prescriptive checklist.
Payment Card Industry Compliance (PCI), Standardized Information Gathering Lite (SIG Lite), Center for Internet Security (CIS), and SIG Core, all are hovering close together, bringing in the middle ground of compliance. This may indicate that the requirements are a little more prescriptive and rigid, however, there are guidelines that are relatively attainable. ISO 20071 has the highest percentage of requirements that are potentially noncompliant, which is not surprising given that this standard requires buy-in and compliance in almost every single part of a company.
What's in Scope Though?
With this sort of outside-in visibility, we have to account for the fact that at least some of the findings will be on low-value assets, which aren’t in scope for audit. They may not even necessarily put the organization at risk of lateral movement if other mitigations such as segmentation are in place. To take the analysis to another level we now narrow the lens to focus on high-value assets.
While we don't know which regulatory standards govern each organization, nor which of the assets or hosts are in scope for specific compliance mandates, we can make some reasonable assumptions about business criticality based on what the assets do. RiskRecon can discover what types of data collected by assets. When this information includes sensitive data like user credentials, email addresses, and credit card numbers, the assessment engine categorizes a system as a high value asset. With many of our standards taking a data-centric approach (cardholder data in the case of PCI, PII in the case of GDPR, etc.), these indicators of high-value are reasonable proxies to identify the assets that are more likely than others to be in scope.
With that in mind, we turn to look at the percentage of organizations with noncompliant findings on a high-value asset. The numbers go down, once we consider the criticality of systems. In Figure 2, we focus only on the high value assets. With this lens, almost every compliance standard has a rate of noncompliant organizations of about 12%. The one exception is NIST CSF, for which that rate goes down to just over 8%.
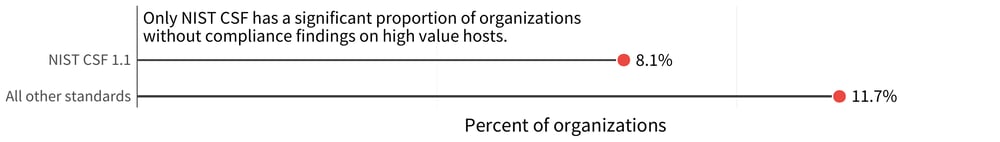
FIGURE 2: ORGANIZATIONS WITH NONCOMPLIANT FINDINGS ON HIGH-VALUE ASSETS
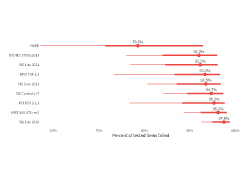
\Lest we get too optimistic about these numbers, let's look at the rate of noncompliance on the assets and hosts themselves. This data is a little more sobering, as the majority of high-value assets — over 80% — have at least one noncompliant finding on them. NIST CSF is the exception here as well, with under 20% of high-value assets showing some evidence of noncompliance there.
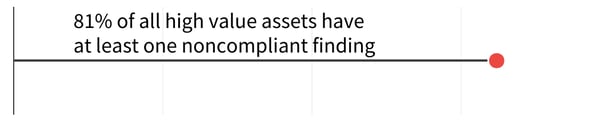
FIGURE 3: PERCENT OF HIGH VALUE ASSETS WITH AT LEAST ONE NONCOMPLIANT FINDING
The difference between this chart and Figure 5 indicates that not every organization runs high-value assets, but among those that do, the rate of noncompliance is still very high. The good news is that the binary indications of noncompliance are not as universal on these assets as on the entire sample, which means at least some level of attention is being paid to the in-scope assets.
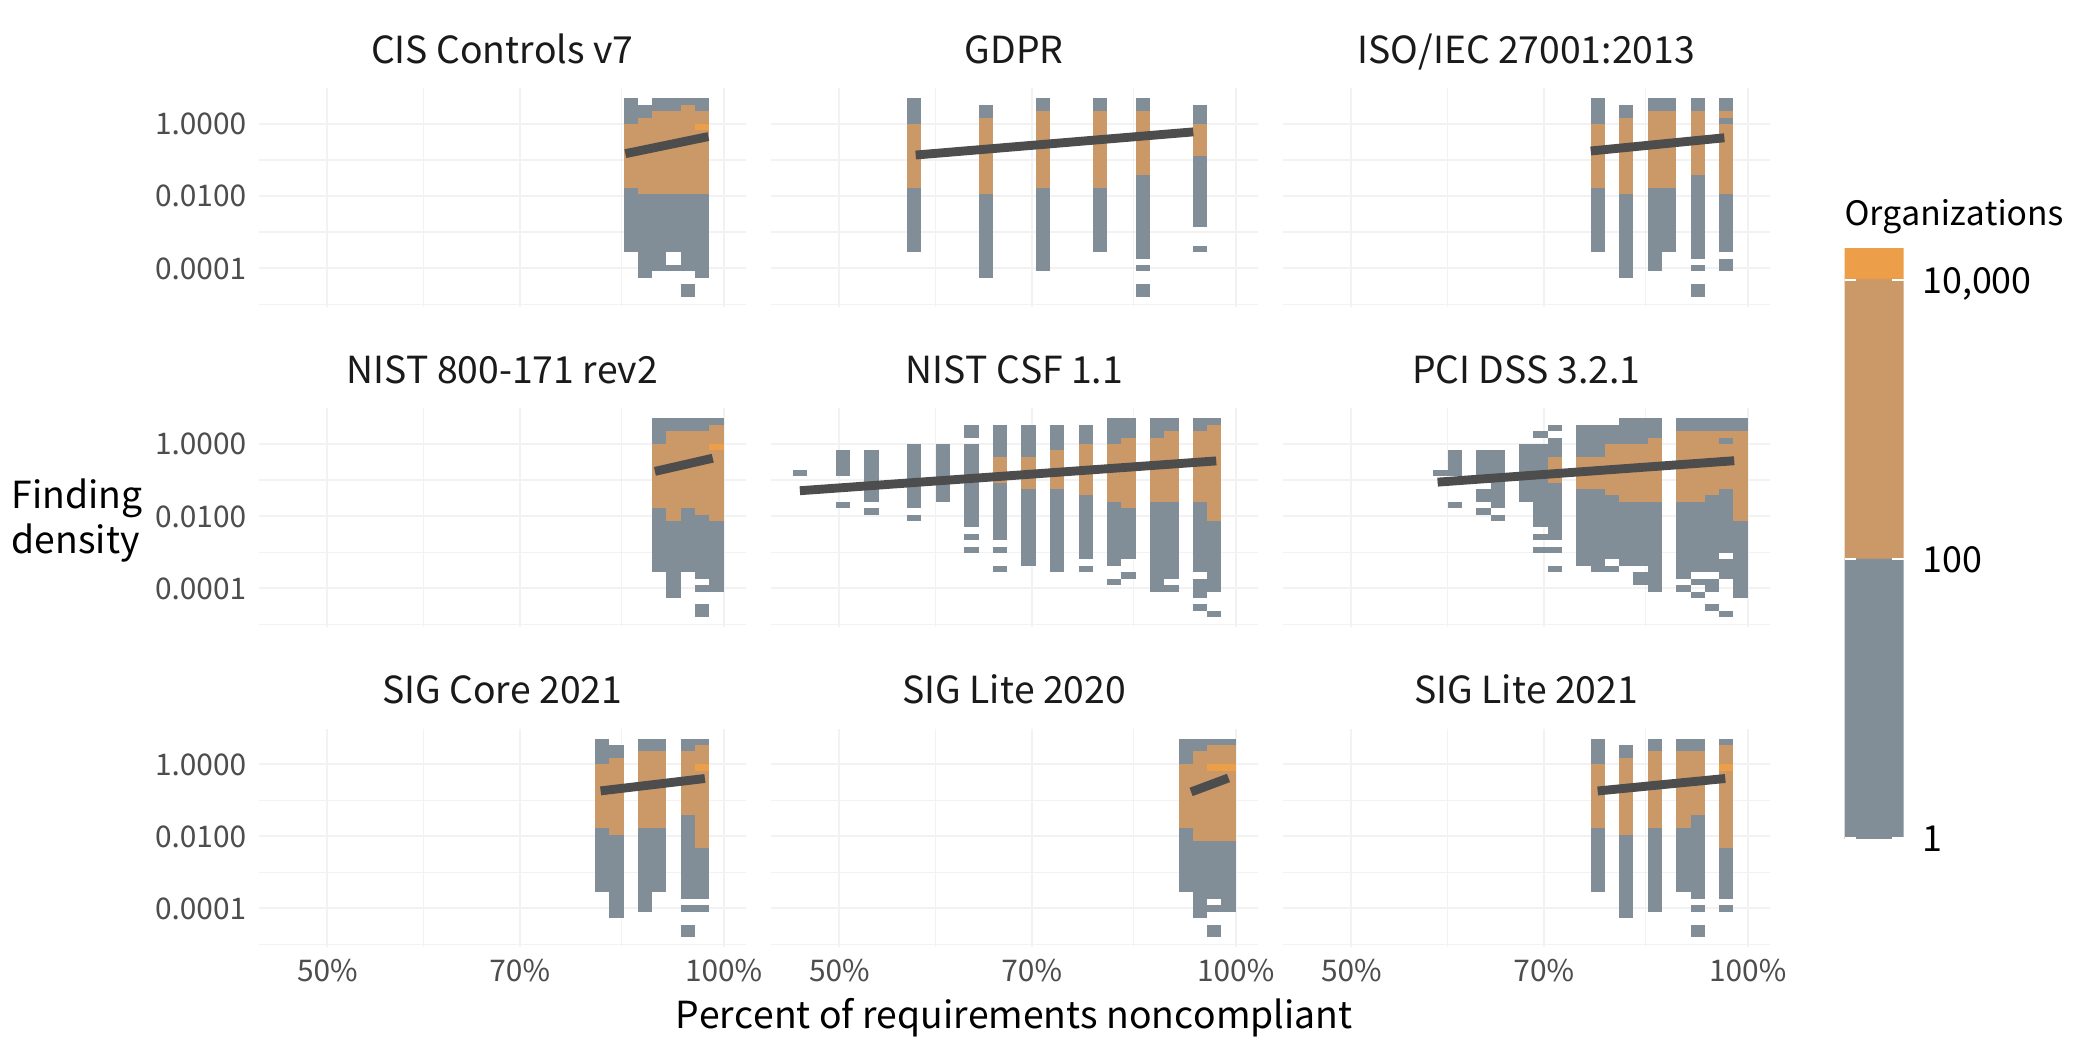
Another variable to consider is that organizations differ in size, with some operating with just a few hosts under their care, and others running several orders of magnitude more assets. This means, an organization could potentially have a large number of findings, but it may not be a big deal if those assets are spread out across a lot of hosts. But another organization with a similar number of findings clustered within fewer hosts could be operating under a much more acute state of noncompliance (and risk!). To normalize the data a bit, we looked at the data based on the density of noncompliance, in other words, the number of compliance findings on high value hosts divided by the total number of high value hosts at organization. This provides a better understanding of the scope of the issues. This gives us the view in Figure 4.
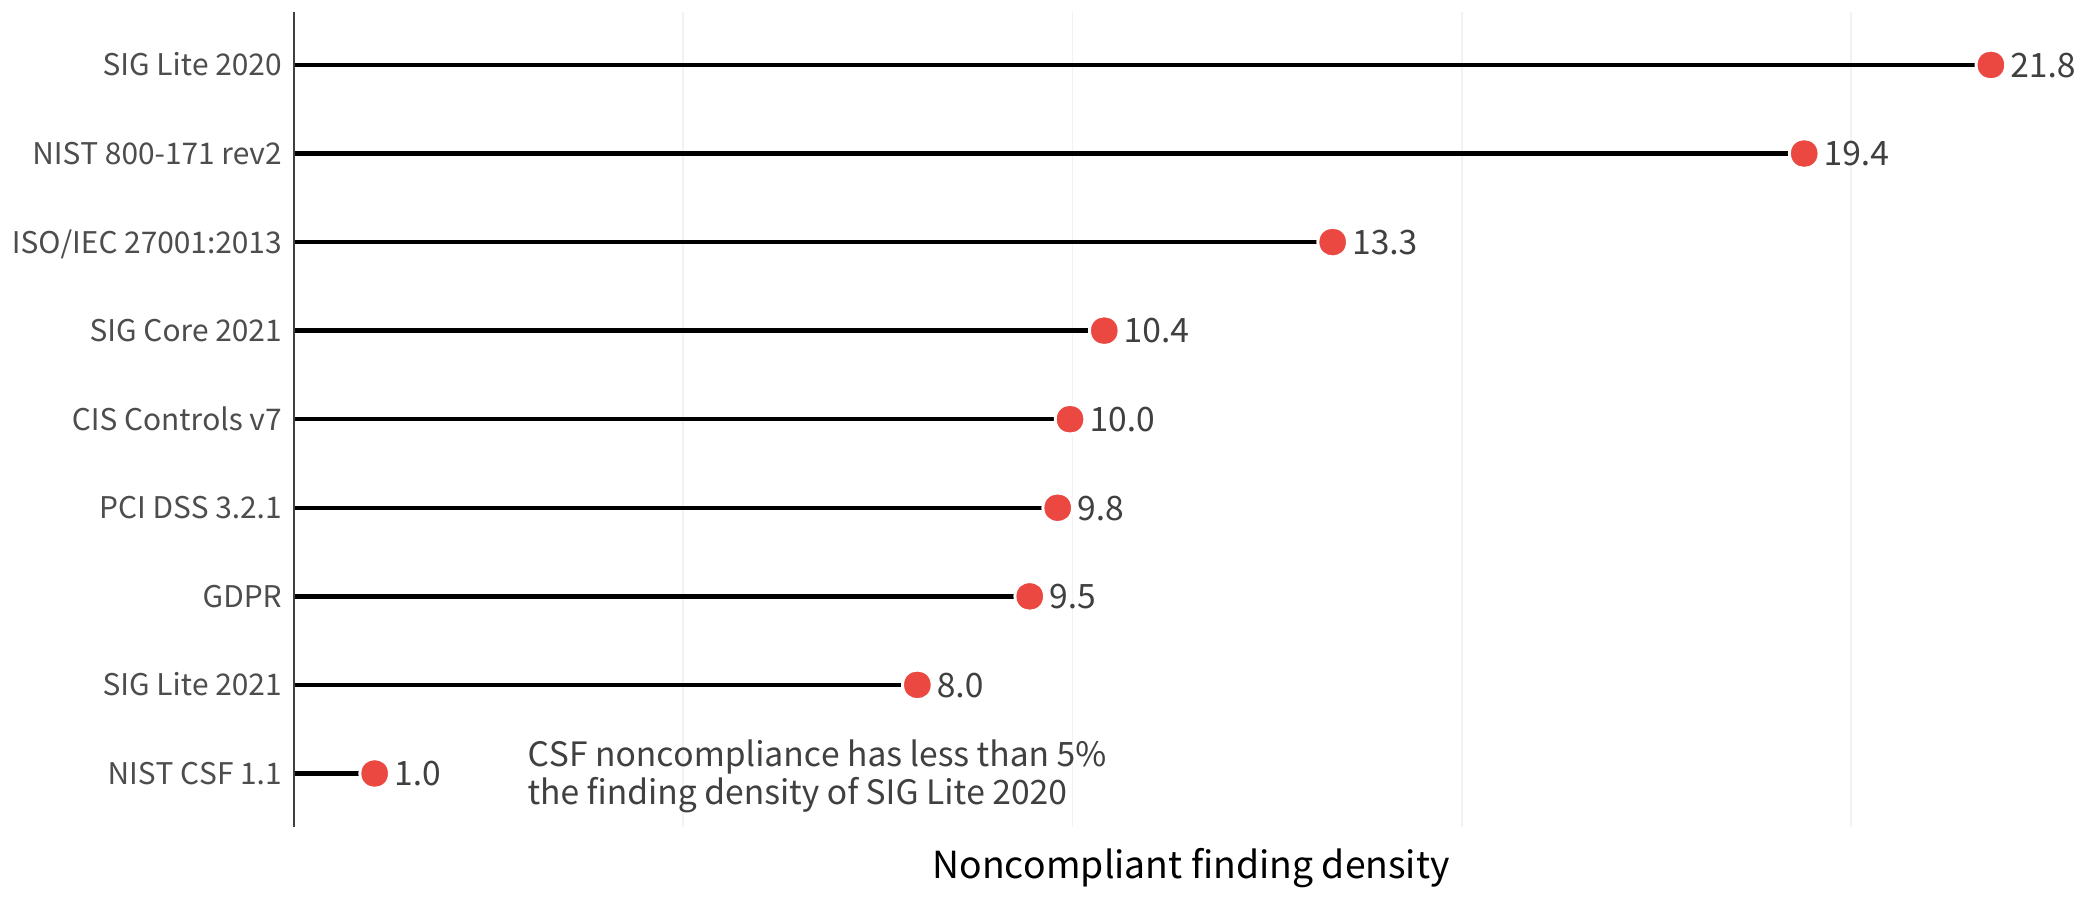
FIGURE 4: NON-COMPLIANT FINDING DENSITY IN ORGANIZATIONS WITH COMPLIANCE FINDINGS
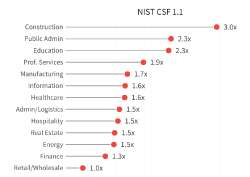
In Figure 5, we can focus on the PCI-DSS top level requirements to better see the differences. Organizations with issues in the testing of systems and processes have 38 times the finding density compared to that of organizations that have issues with protection against malware.
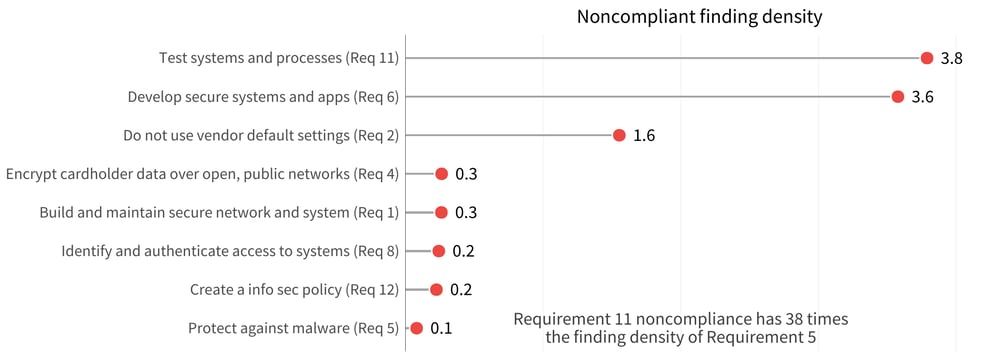
FIGURE 5: FINDING DENSITY ACROSS NONCOMPLIANT PCI-DSS REQUIREMENTS