We’ve examined a lot of factors that tell us how each organization’s risk surface is dependent on the choices that it makes, regardless of the industry. Many of these factors such as the number of hosts and geographic location have little effect on separating the winners and losers, while others such as cloud adoption have a significant effect on where an organization lands.
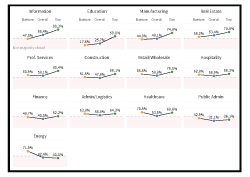
 Looking at the technical footprints of firms, again, we see some differences between the top and bottom performers.
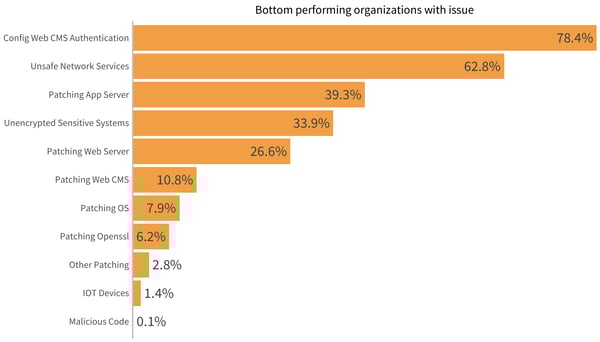
Overall, web CMS authentication and patching application servers seem to be the “top” problems for all bottom performers. Patching in general seems to be a recurring issue for bottom performers, so perhaps a good question to ask a potential partner is how they manage to patch their software and tools.
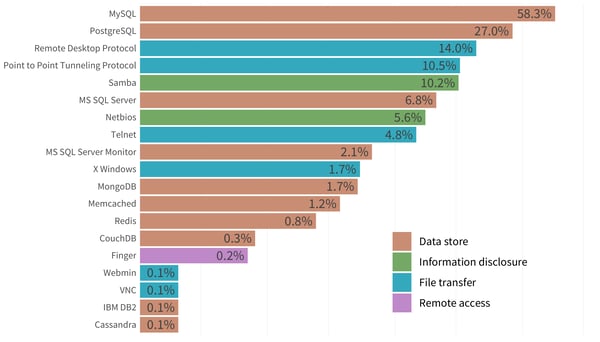 When we look at the unsafe services in the above figure, we notice that MySQL has the most instances among the bottom performers, being the only one to pass 1,000 instances out of all these technologies.
So, what does that mean in terms of what the technologies actually do? The image shows the distribution of purposes of each of these surfaces. For example, out of all the database listeners, we see that MySQL has the most instances, while IBM and Cassandra have the least.
When we look at remote access services, the remote desktop protocol has the most instances, while VNC and Webmin have the least. Recognizing that each technology comes with its pros and cons is part of risk management. Further, it is important to be warned that you should take a closer look at the technologies that a potential partner utilizes before making your decision.
There was no time when a top performer had an instance when a bottom performer did not. What this suggests is that it is not necessarily the size of the technical footprint that matters but what technologies make up the footprint.
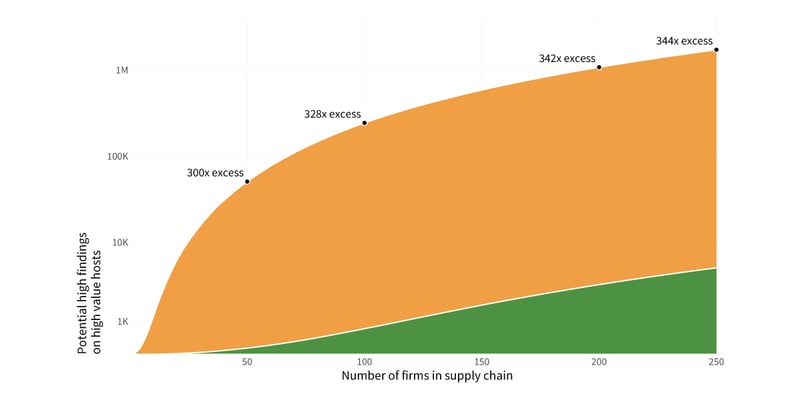
Assumptions are usually half-based on fact and partly on a mix of urban legends, anecdotes, and educated guesses. When trying to assess the risk surface of an organization, whether it’s yours or someone else’s, it’s tempting to start by making certain assumptions based on the industry the organization is in. What we can confidently say is that when you choose to partner with a top performer, you will be better off. How much better? More than 300-times better.
Such a large multiple must be backed up with data, so we’ll add one more chart before closing this article. The graphic below expands on the first chart in blog one from our research. It shows the compounding negative impact of choosing multiple third parties from among the bottom performers as opposed to choosing them from among the top performers. There is a clear and large impact on the business decisions we make, and with every incremental increase in the number of firms in your supply chain, the impact of choosing the top or bottom performers will be that much greater.
 Download the full report here to see how you can understand and navigate the internet risk surface safely.