In our most recent analysis, we delved into a wealth of nearly 900 ripple events from the past, with the aim of unraveling the prevailing techniques employed by MITRE ATT&CK. Our ultimate objective is to acquire a deep understanding of how these ripples emerge and spread, guaranteeing that your organization remains unscathed in their aftermath.
Once attackers have the requisite depth and breadth of access into the environment(s), they will take action to achieve their ultimate goal(s). This generally involves exfiltrating data (TA0010) and/or negatively impacting systems (TA0040).
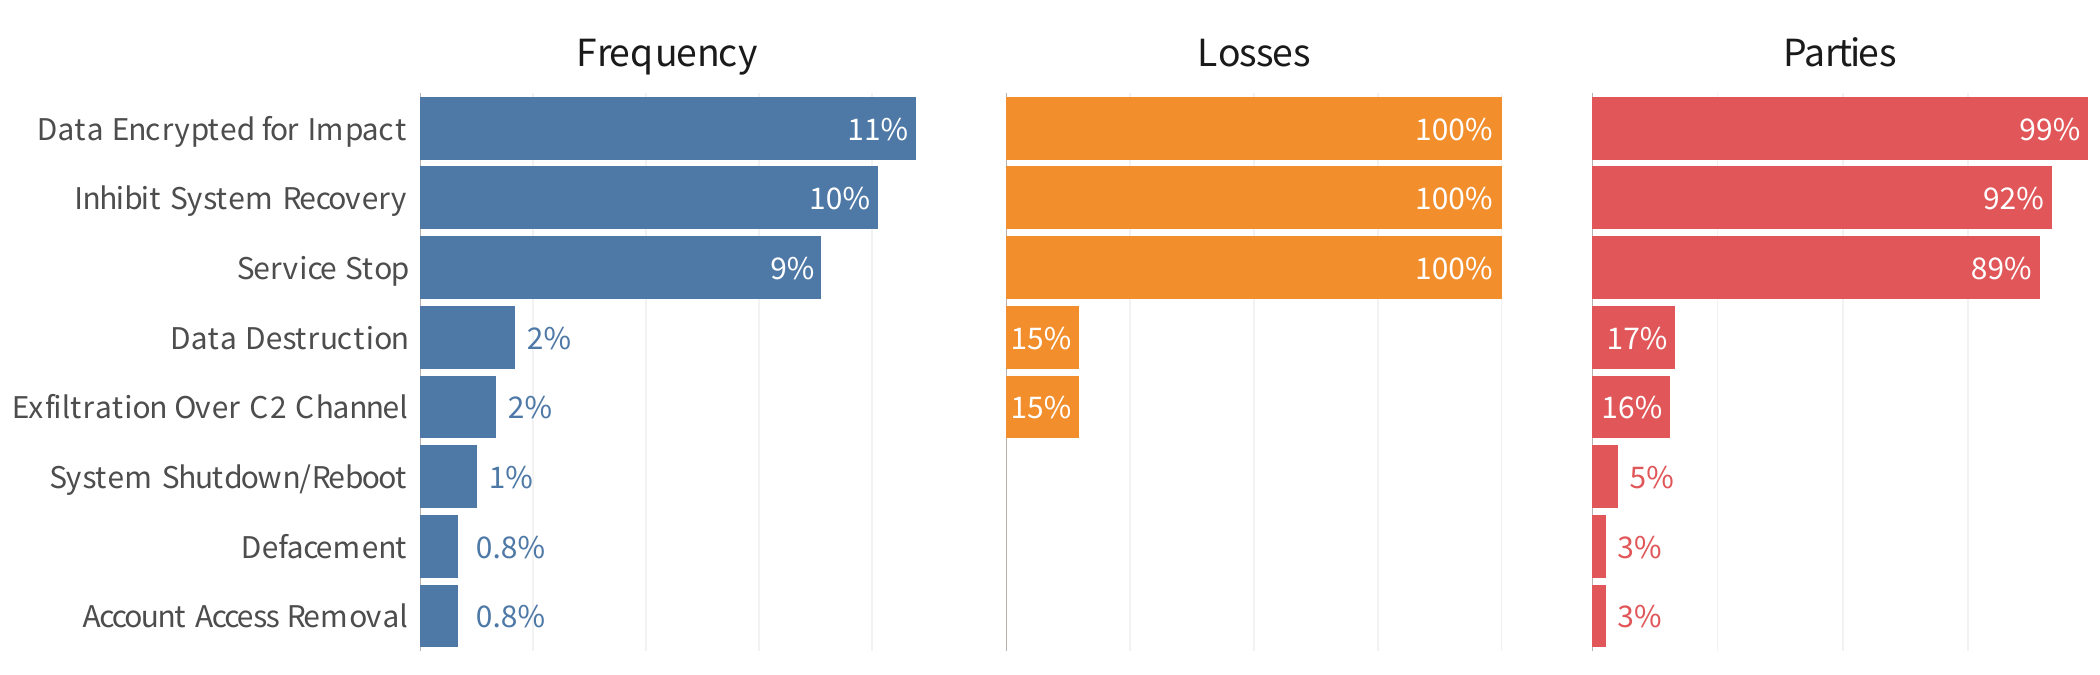
Key stats associated with top exfiltration & impact techniques used in ripple events
Top Exfiltration & Impact Mitigations
Accordingly, the mitigations that are likely to be most impactful at this stage include backing up data, further restricting permissions, and altering system configurations.
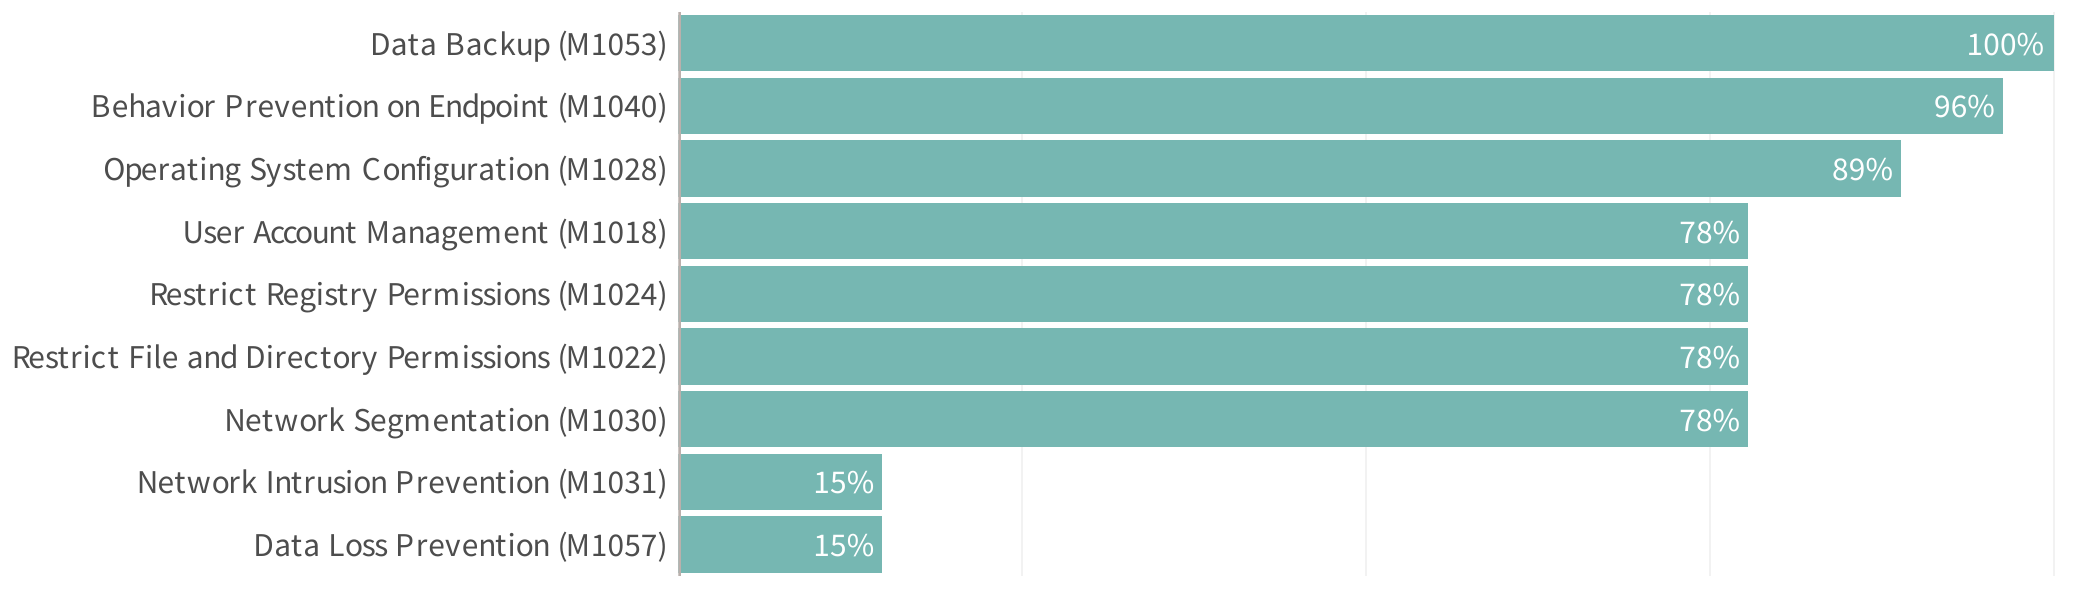
Recommended mitigations for the most common exfiltration and impact techniques
Comparing Key Metrics Across ATT&CK Techniques
Breaking incidents down into major phases or tactic clusters, as we’ve done thus far, helps keep things focused and manageable. It’s also helpful to zoom out and see the bigger picture - which is exactly what we’ll do here.
The following chart compares the relative frequency (horizontal axis), financial losses (vertical axis), and the number of downstream parties impacted (size of dot) among ATT&CK techniques identified across all ripple events. We have also color-coded these techniques according to the tactic grouping in which they appear, whether it be initial access, post- compromise, exfiltration, or impact.
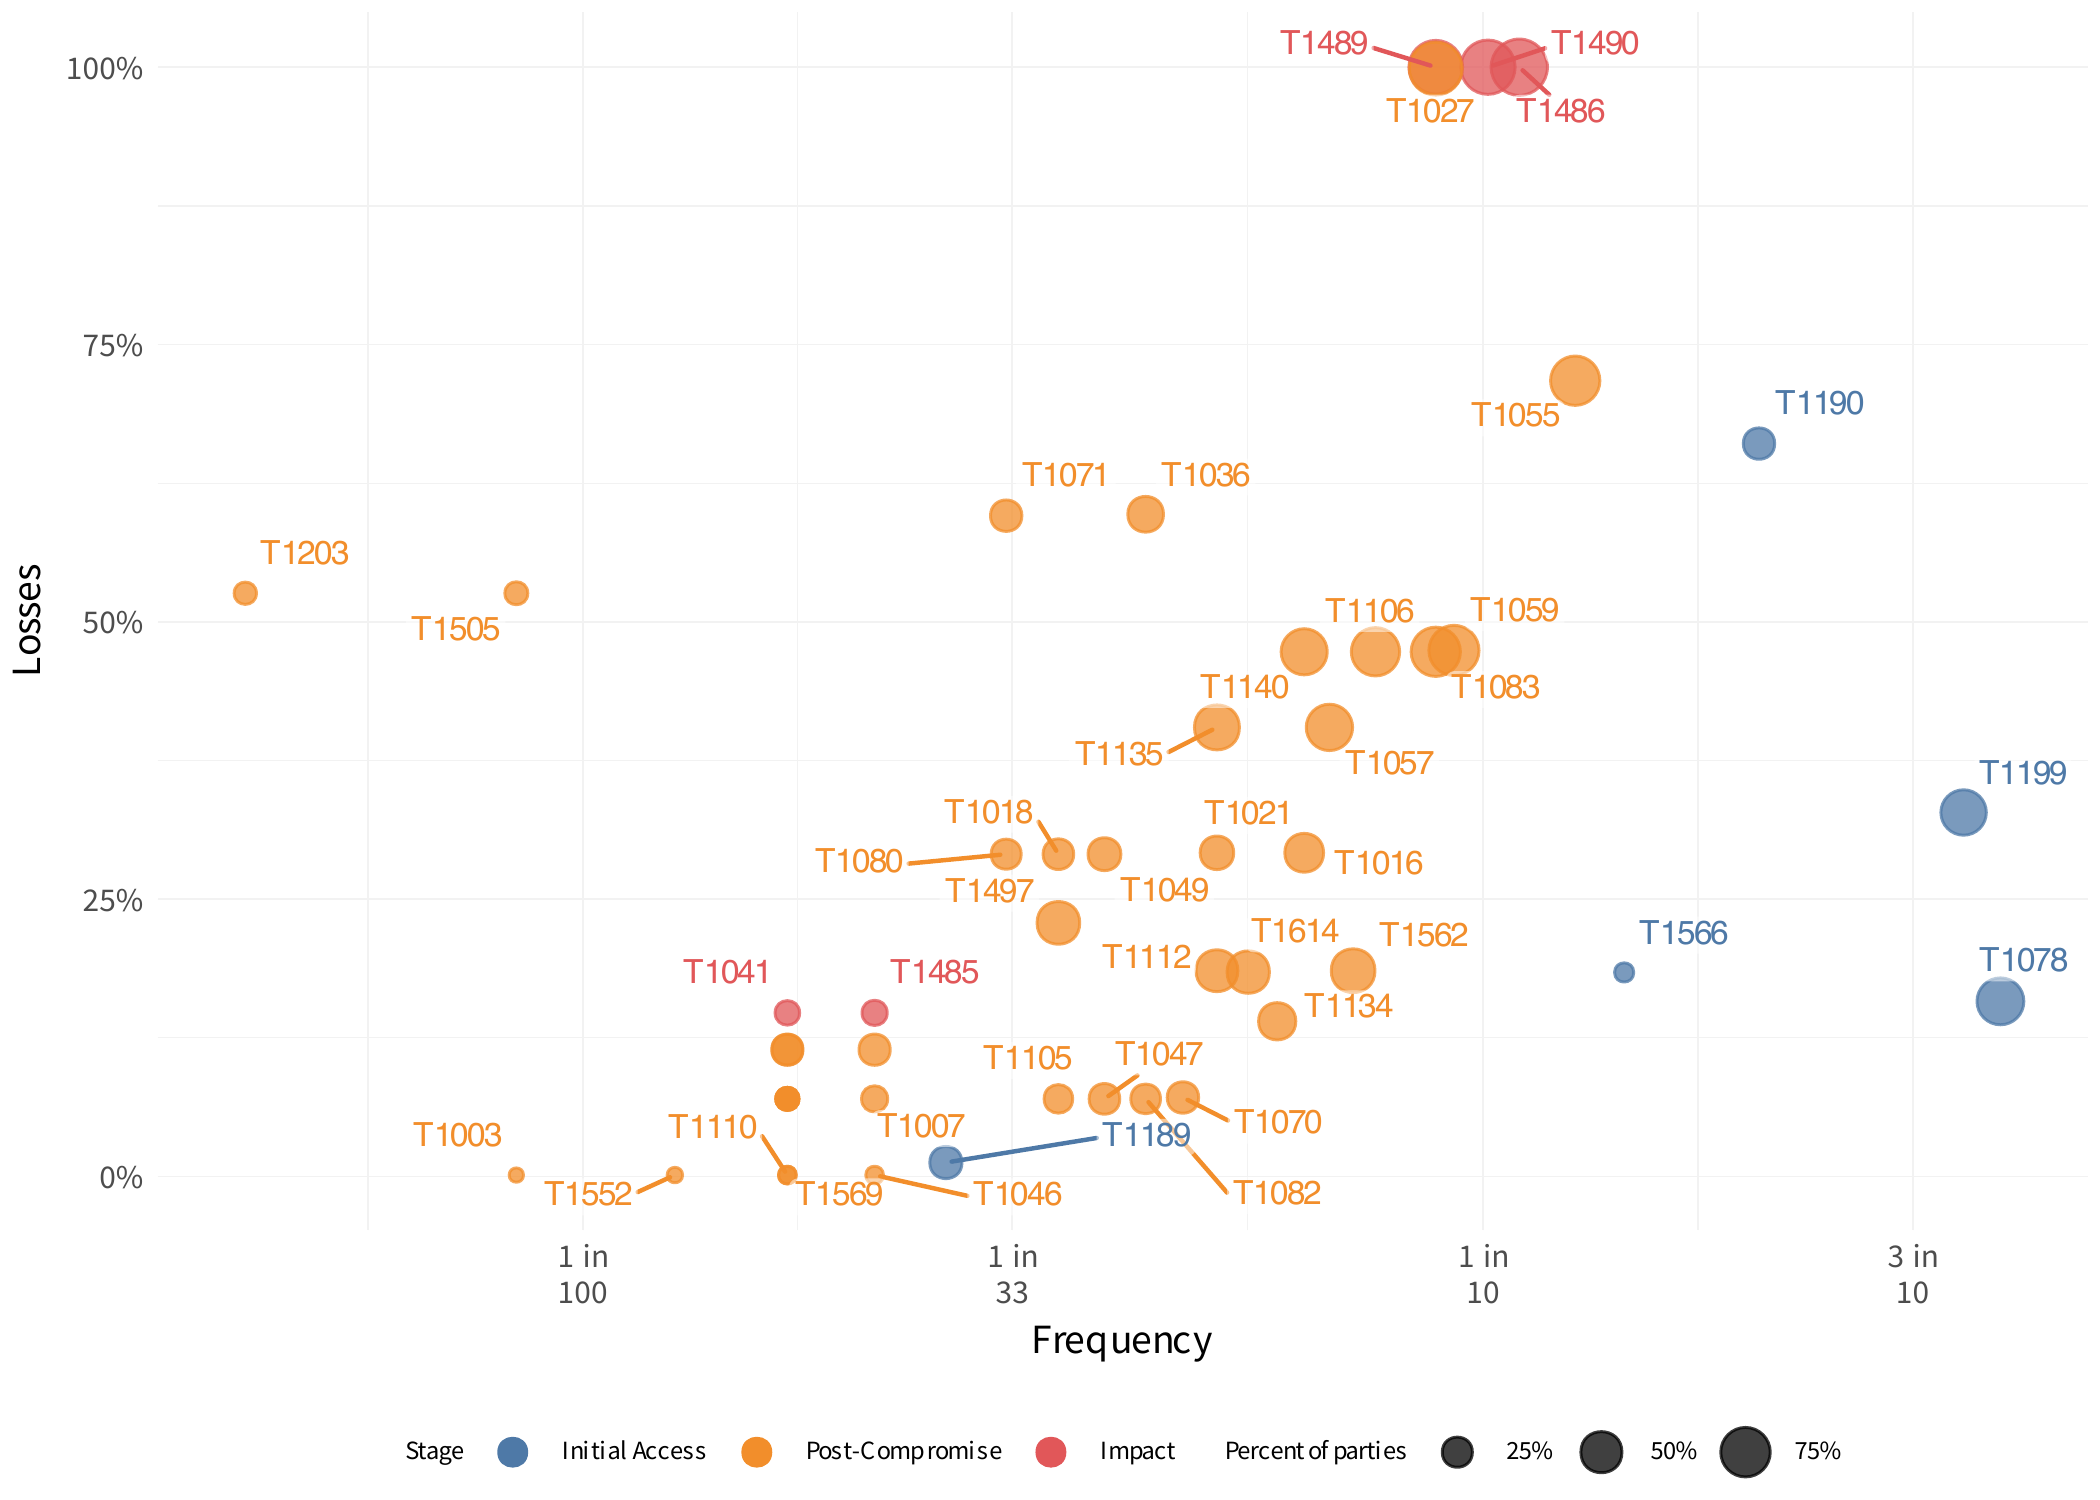
Relative frequency, losses, and impacted parties for all ATT&CK techniques identified in ripple events
We understand that you likely don’t have the ATT&CK identifiers memorized, and including the full names for all of them would make this chart unreadable. To look them up, you can visit this site. Techniques are color-coded according to the phase in which they appear.
Having already discussed these and many of the others in graph above, within their respective tactic groups above, we will not repeat that information here. However, we do hope that it assists your organization in quickly assessing which ATT&CK techniques represent the greatest risk for multi- party cyber events.
Top Overall Mitigations
By now, you recognize the pattern: we present techniques, and then we present their mitigations; however, it is not quite as simple when showing as many techniques as we have.
The chart below connects observed ATT&CK techniques to their potential mitigations. The size of the dot corresponds to how often each technique or mitigation was associated with an event. The connecting lines denote the strength of correlation between techniques and mitigations, with bolder lines indicating a stronger correlation.
You could attempt to follow the lines to identify all possible mitigations for techniques of interest; but, in honesty, this task would be much easier using MITRE’s site. We chose this view because:
- It portrays the complex, interconnected nature of The chart below connects observed ATT&CK
defending against ripple events. - It reinforces the idea that multiple ways of mitigating the top ATT&CK techniques exist.
- It demonstrates the possibility of defending against multiple techniques with a single mitigation.
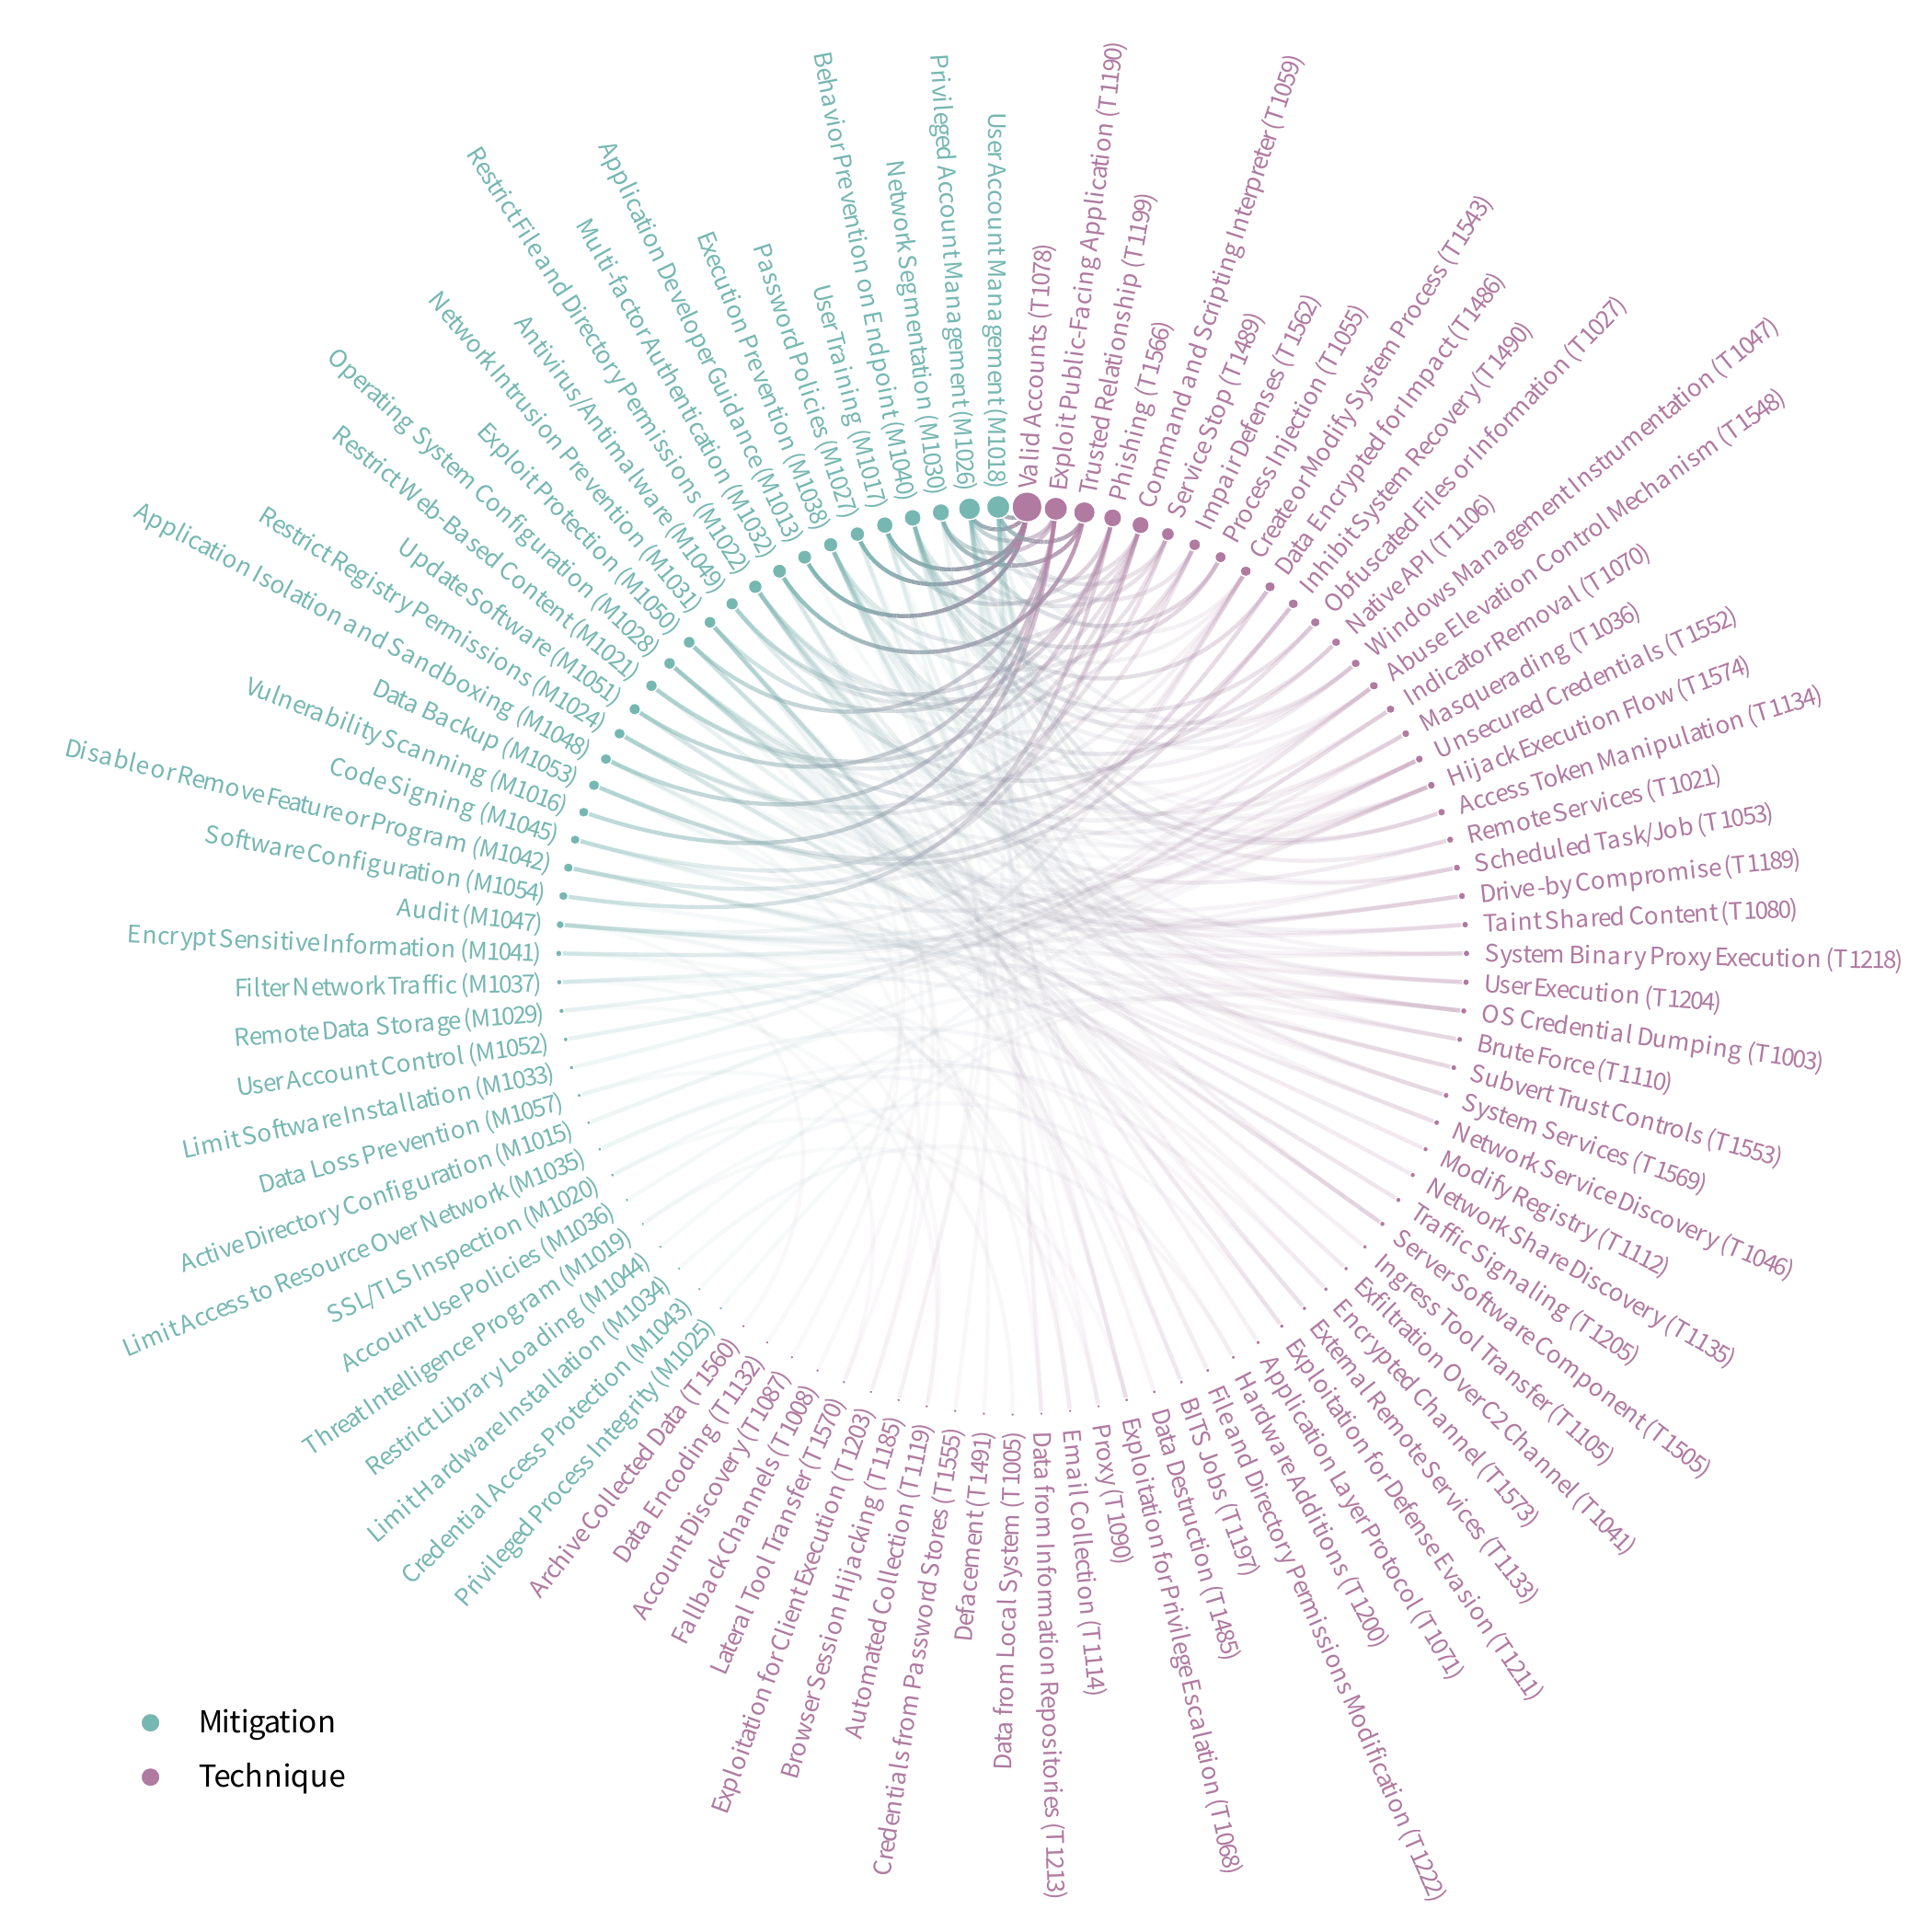
Recommended mitigations for top ATT&CK techniques contributing to ripple events
Download our report to understand the risks to your digital supply chain. With analysis of 900 ripple events, we've identified techniques used by MITRE ATT&CK. Armed with this knowledge, you can protect your organization and ensure a secure and resilient supply chain.