How big are the waves from Ripple events? This question is likely top of mind for many readers of this research. After all, “Tsunami” connotes waves that swell up, travel far, and leave a trail of damage in their wake. Hydrologists have several methods of measuring real-world tsunamis, and we’ll look at a few different ways of sizing up the cyber tsunamis in this study (albeit with far less precision).
Number of impacted organizations
Let’s begin with the number of secondary firms impacted by these mega multi-party cyber incidents. We took a conservative approach to enumerating, relying either on specific entities identified in Advisen’s dataset or on a number reported publicly by the central organization itself. Also, keep in mind that this isn’t the only criterion by which an event might be considered a tsunami (which is why a quarter of these incidents encompass just three to four firms).
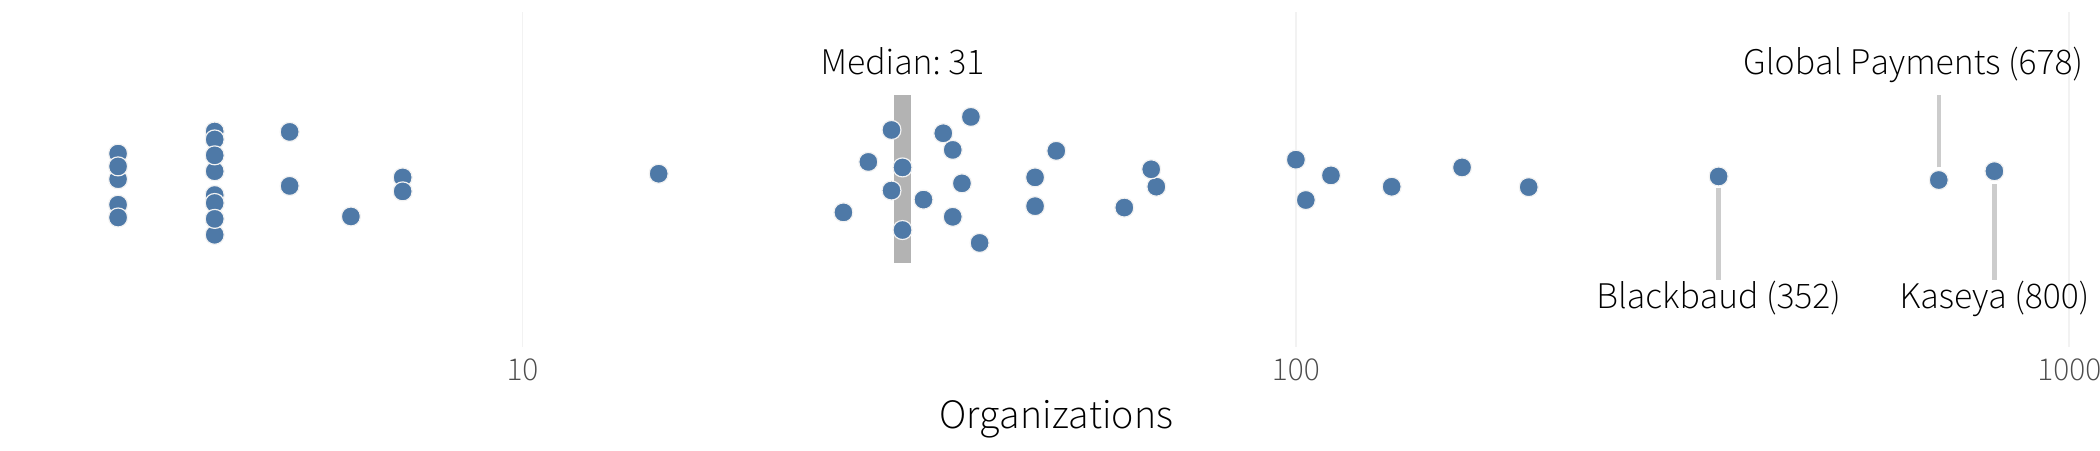
FIGURE 1: NUMBER OF SECONDARY FIRMS IMPACTED BY EXTREME MULTI-PARTY CYBER INCIDENTS
The median number of secondary organizations swept up in the wake of one of these digital tsunamis is 31. One in four of these incidents impacted 55 firms or more, and the largest among them encompassed no less than 800 organizations! These numbers serve as a reminder of the highly interdependent nature of modern business where one firm’s breach can have spillover effects across many, many more.
Amount of data compromised
We’ve gone on record saying that the number of records compromised is not a good predictor of the financial losses associated with a breach. So don’t worry—we’re not going to attempt that here. Taken alone, it simply serves as another way of sizing up these events.
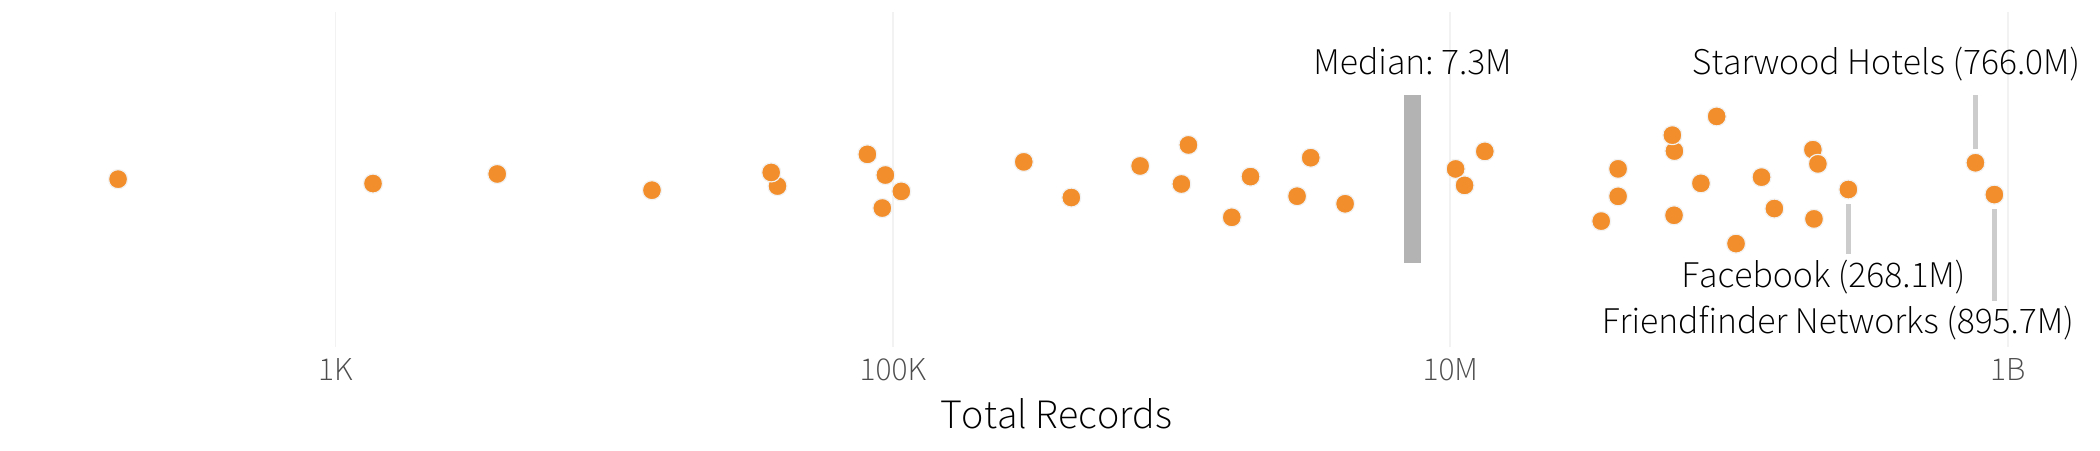
FIGURE 2: NUMBER OF DATA RECORDS COMPROMISED FOR EXTREME MULTI-PARTY CYBER INCIDENTS
As measured by the median, the typical tsunami swallows up over seven million data records across all organizations affected.
The 75th percentile swells to over ten times that number, reaching beyond 82 million records. Nearly one in five of these events exceeded the vaunted 100 million mark! We won’t go into detail on the types of data compromised, except that personal information (37 events) and payment account data (26 events) led the pack.
Total financial losses
We feel obliged to offer a couple of caveats before sharing statistics on the financial impact of tsunami events. First, these figures represent publicly-reported quantifiable losses that are tied to these incidents. They do not include many of the soft or indirect costs experienced by the victim organizations that go unreported in public documents such as Securities and Exchange Commission (SEC) filings. Second, note that we were only able to find verifiable data on losses for 30 of the 50 incidents. And lastly, remember that we’re focusing on a small set of the largest multi-party cyber loss events, so what you see here doesn’t in any way represent the broader distribution of all security incidents.
With that out of the way, let’s inspect the price tag on these mega multi-party incidents. The median loss magnitude stands at a whopping $90 million. To put that in perspective, our analysis of all loss events in the IRIS 20/20 pegged the median at a “paltry” $200,000. It even doubles the median loss of $47 million set by the IRIS Xtreme for the 100 largest security incidents over the past five years.
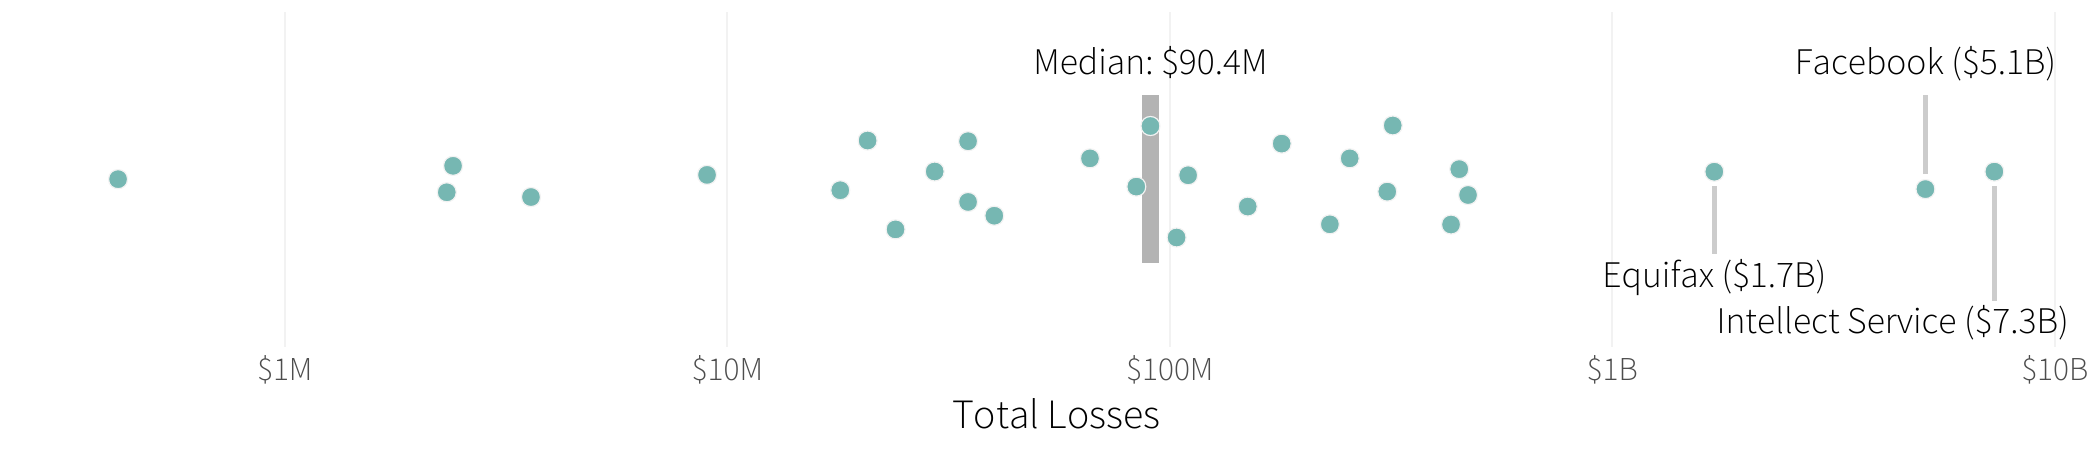
FIGURE 3: TOTAL RECORDED FINANCIAL LOSSES FOR EXTREME MULTI-PARTY CYBER INCIDENTS
More parties, more pennies
Figure 4 compares the loss magnitude for single (green) vs. multi-party (orange) incidents. Notice how the distribution for multi-party events shifts substantially to the right. The median loss for multi-party incidents is over 10x that of their single-party cousins. Also notice that the tail is much thicker, indicating a higher propensity for major loss events. Extreme losses (95th percentile) for ripple events near $400 million but fall well below $20 million for traditional incidents.
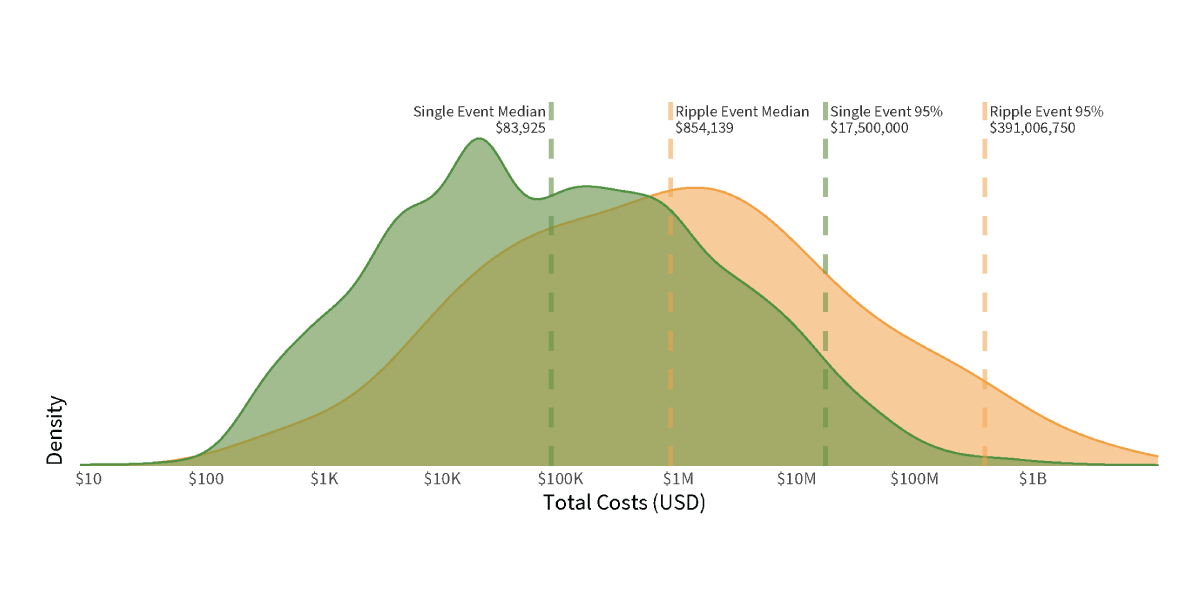
FIGURE 4: TOTAL RECORDED FINANCIAL LOSSES FOR SINGLE-PARTY VS. MULTI-PARTY SECURITY INCIDENTS
The fact that multiple parties contribute to multiplying costs is far from shocking. But it still serves as a reminder of risk accumulation. We tend to focus on assessing “our” (own) risk and don’t always consider “our” (collective) risk. Are you ready if all those downstream losses wash back over your organization?