For the second time in a row, we used Advisen’s Cyber Loss Database to uncover the scope of multi-party incidents since 2008. Containing over 103,000 cyber events collected from publicly verifiable sources, the database is widely used for long-term analyses of breaches over the last decade and beyond. Two features that make it particularly apropos for this ripple research is that it associates organizations involved in or impacted by a common incident, and it tracks losses disclosed publicly in the wake of those events.
Since 2008, more than 2,726 incidents in the Advisen database involve more than one organization. However, only a subset of those are true ripple events involving some form of B2B relationships between multiple parties. Using that as a filter, our incident base totaled 897 incidents.
Our goal for the latest analysis of this base was not only to understand how things changed with new ripple events in the last year but also gain deeper insights into the entire data set. We not only performed a different analysis this year to bolster last year’s look into over a decade of ripple events but also revisited our previous data observations to account for changes to the data set that might naturally occur over time due to the nature of how ripple events unfold.
Clearly, the relationships between various 3rd, 4th, and Nth parties involved in ripple events can be complex and difficult to track. At times, an organization may be a customer of the generator as well as of other third parties caught in the downstream impact of the ripple. However, a comprehensive mapping of all the connections between firms is not available, preventing us from completely untangling the relationships and providing a crystal-clear analysis of how many ripple events are widespread third-party breaches and how many are also supply chain events.
Nevertheless, the data we do have is sound, and it provides a good sense of how common ripple events are today, the scope of their impact, and the costs of these multi-party incidents on a downstream ecosystem.
WHAT’S NEW: RE-ANALYZING RIPPLE INCIDENTS OVER TIME
One of the most difficult elements of analyzing the numbers around ripple events is determining how long it takes for the secondary and tertiary effects of a generating event to progress across multiple organizations, let alone the time it takes to investigate and observe them. For this reason, the observable ripples experienced from 2008 onward comprise a living data set. In this second edition of our analysis, the new data about old incidents that cropped up made it clear that some were not ripple events, making them fall off the list, and other multi-party incidents that happened years ago were added to the tally as new evidence was observed and reported in our source database.
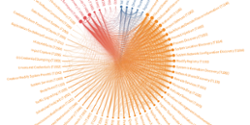
As you can see in Figure 1, based on our analysis in April 2021, 897 multi-party incidents were experienced from 2008 to 2020. Most of those were previously identified ripples.
Figure 1: 897 Ripples, New and Pre-existing
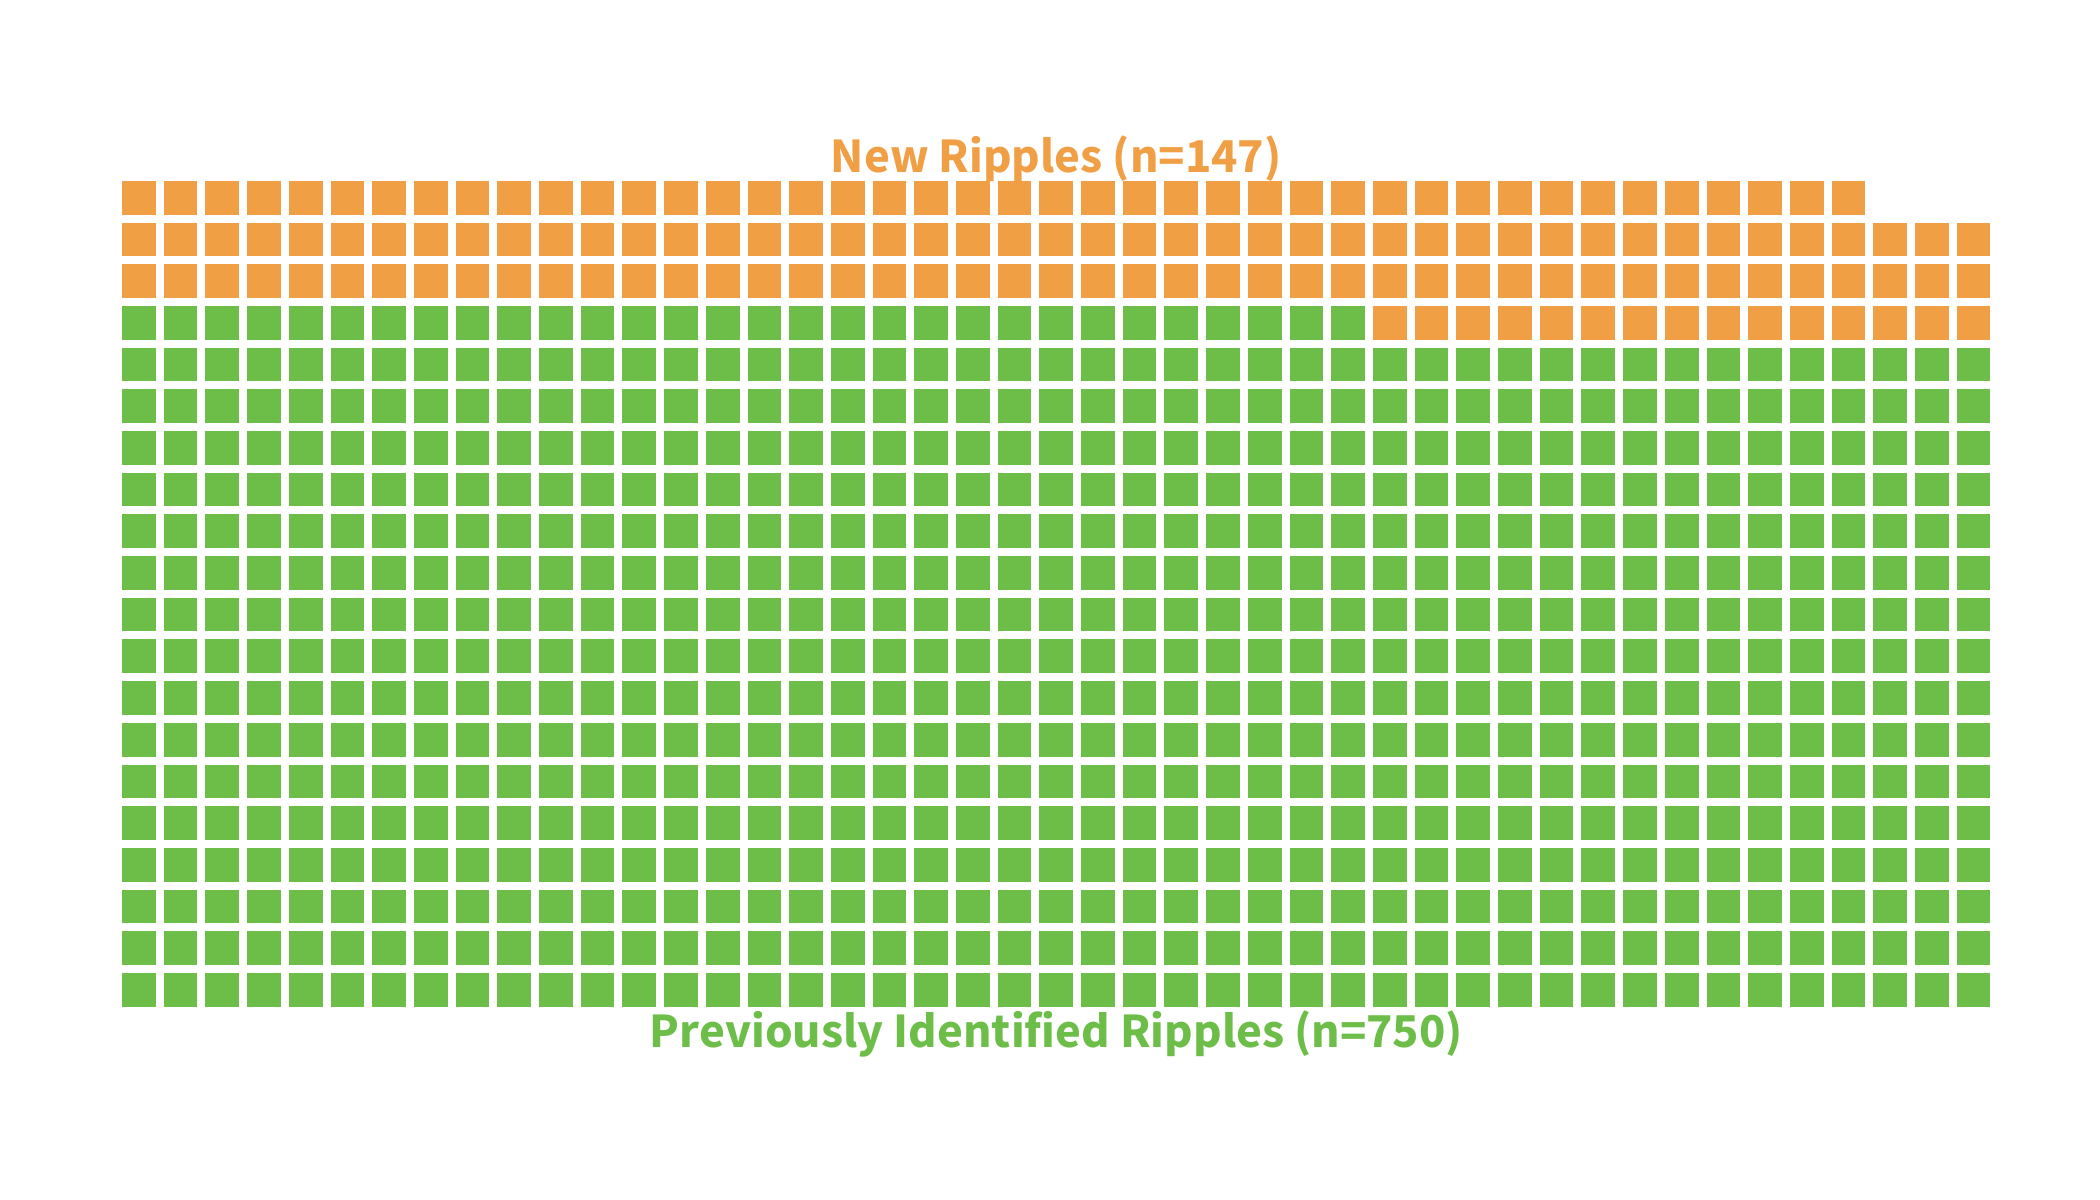 Going further back in time for our latest analysis, we observed 147 newly identified ripples across our entire measurement period. Again, this is expected as more and better information about past events becomes available. Unsurprisingly, the biggest increases can be found in recent years, with a good number of events detected in the mid-2010s as well.
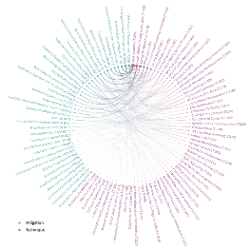
Figure 2: New Ripples Detected Since Last Report
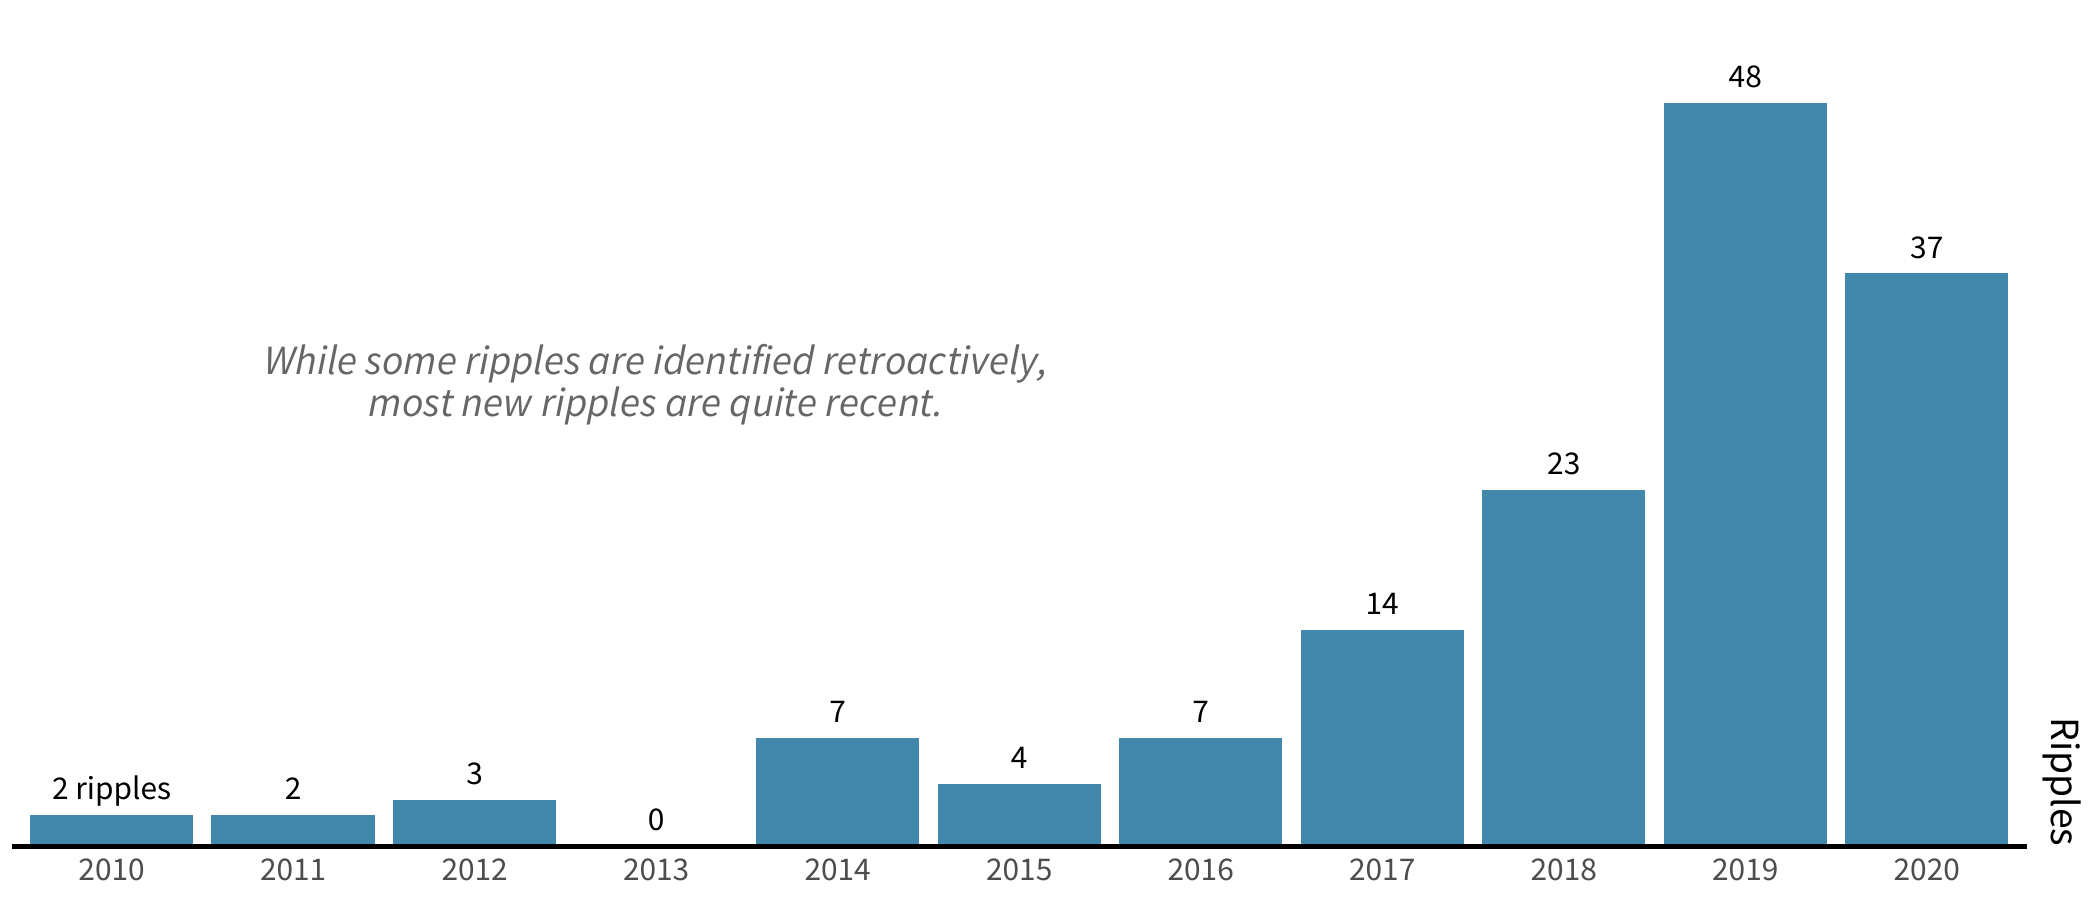
As we can see above, over half of the newly identified ripples were in 2019 and 2020. Our postulation from the last iteration of this report rings true here as we noted then that there’s at least a two-year delay for many ripple effects to fully unfold—and, as this chart indicates, it may even take five years or more for them to become apparent. That’s likely why we see new events from 2019 outpace those for 2020.
We warned in our first report that this lag in observable ripple effects would make it difficult to accurately forecast multi-party incidents. We dived in nevertheless and took our previous projections to task, as depicted in the chart below.
Figure 3: Revisiting Projected Ripples
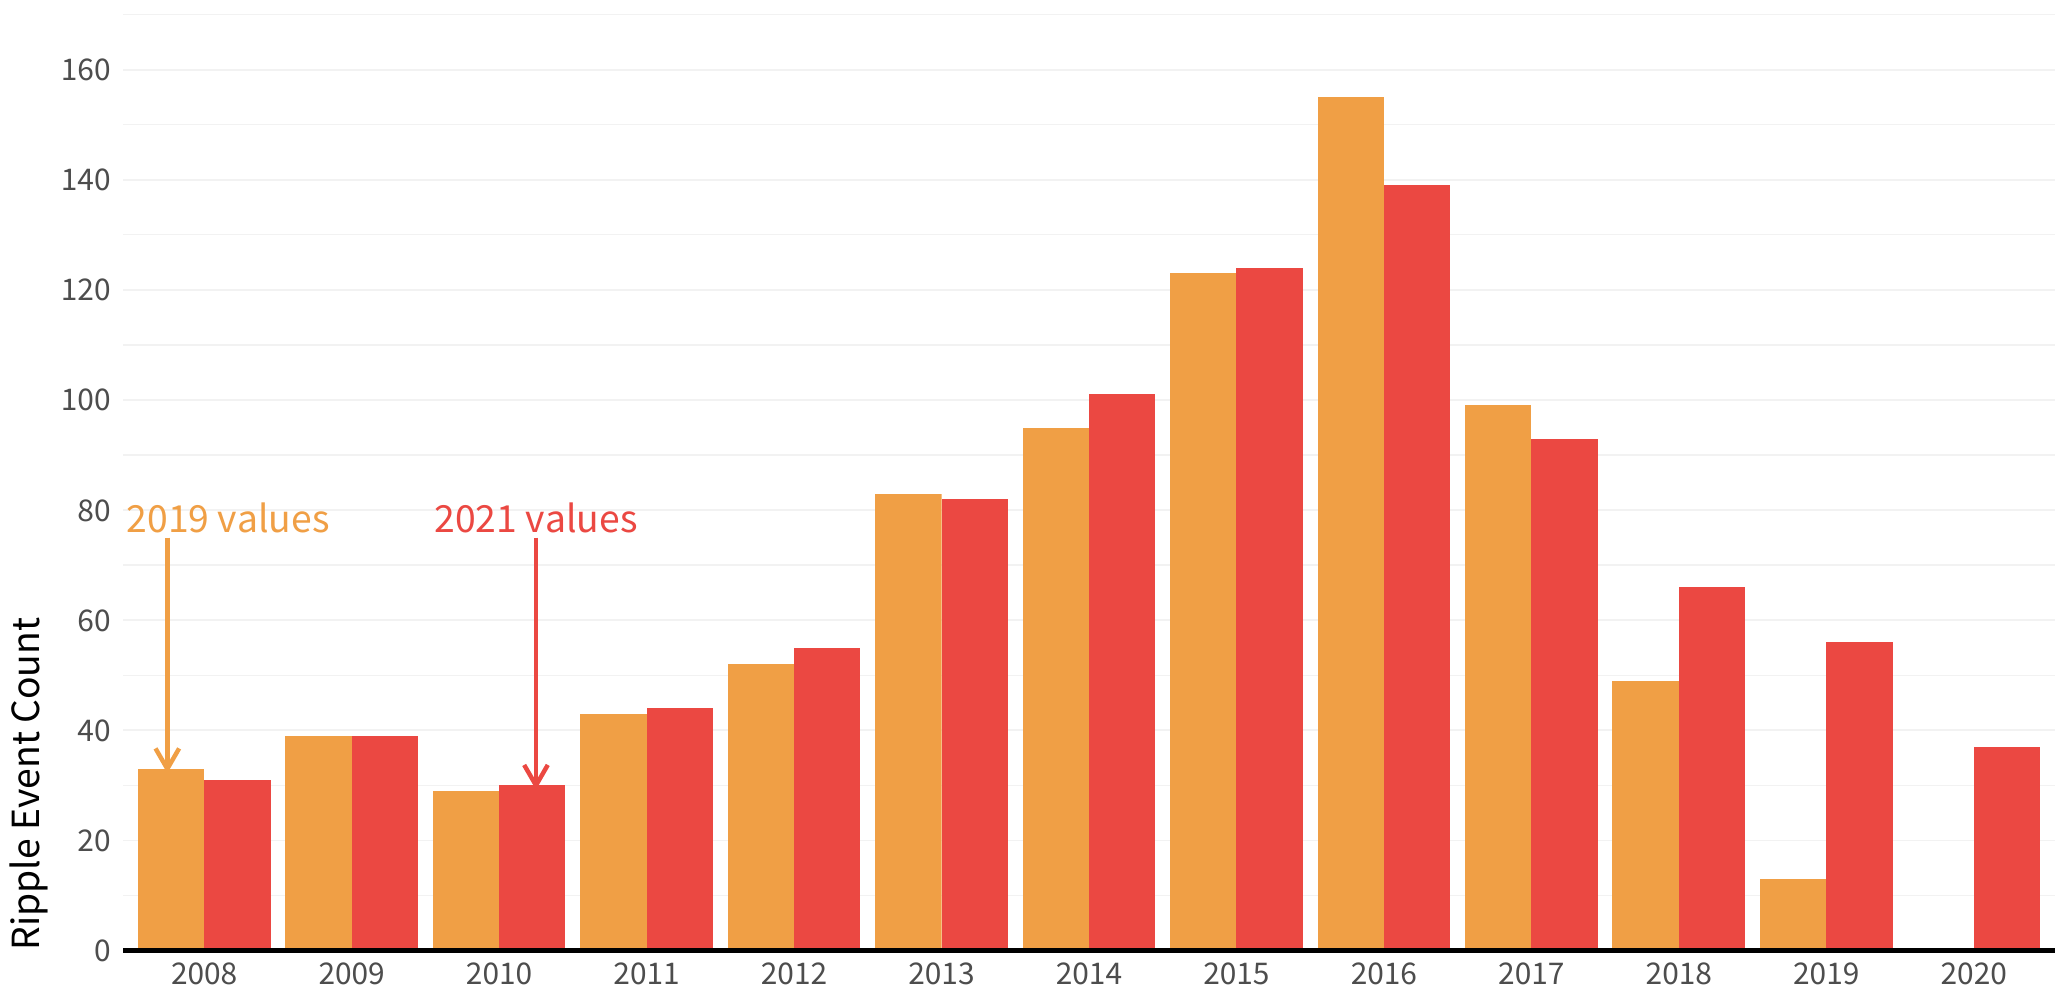
In orange are the ripples recorded in our 2019 report, and in red are the yearly totals of ripples identified as of now. While the number of ripples didn’t explode as we had suspected back in 2019, the yearly number of ripples is relatively stable in recent years (remember that there is typically a lag for events in the past 12–18 months to be identified as true ripples).
There could be a number of different dynamics in play here. It’s conceivable that the number of ripple events really did peak a bit in 2016 and that we will no longer see the perpetual incremental gains up that curve as in years past. However, we do urge caution in concluding that ripple numbers have plummeted or will fall further in 2021, as we believe there are other variables to consider. The observation lag that we’ve noted is an approximation of the public disclosure processes. It is possible that increases in reported ripple events from 2018 through 2020 won’t really stabilize until 2022 or 2023. Once all the long-term observations shake out, we may find that there was a slight peak in 2016 and that the numbers plateaued for the last three years.
However, one thing we definitely don’t expect is for ripple events to decrease significantly over the next few years. The extreme efficacy and very public success of the SolarWinds attack in late 2020, closely followed by the Kaseya attack in July 2021, has provided the bad guys with a proven playbook for supply chain and digital ecosystem attacks that will likely fuel ripple activity in 2021 and beyond.
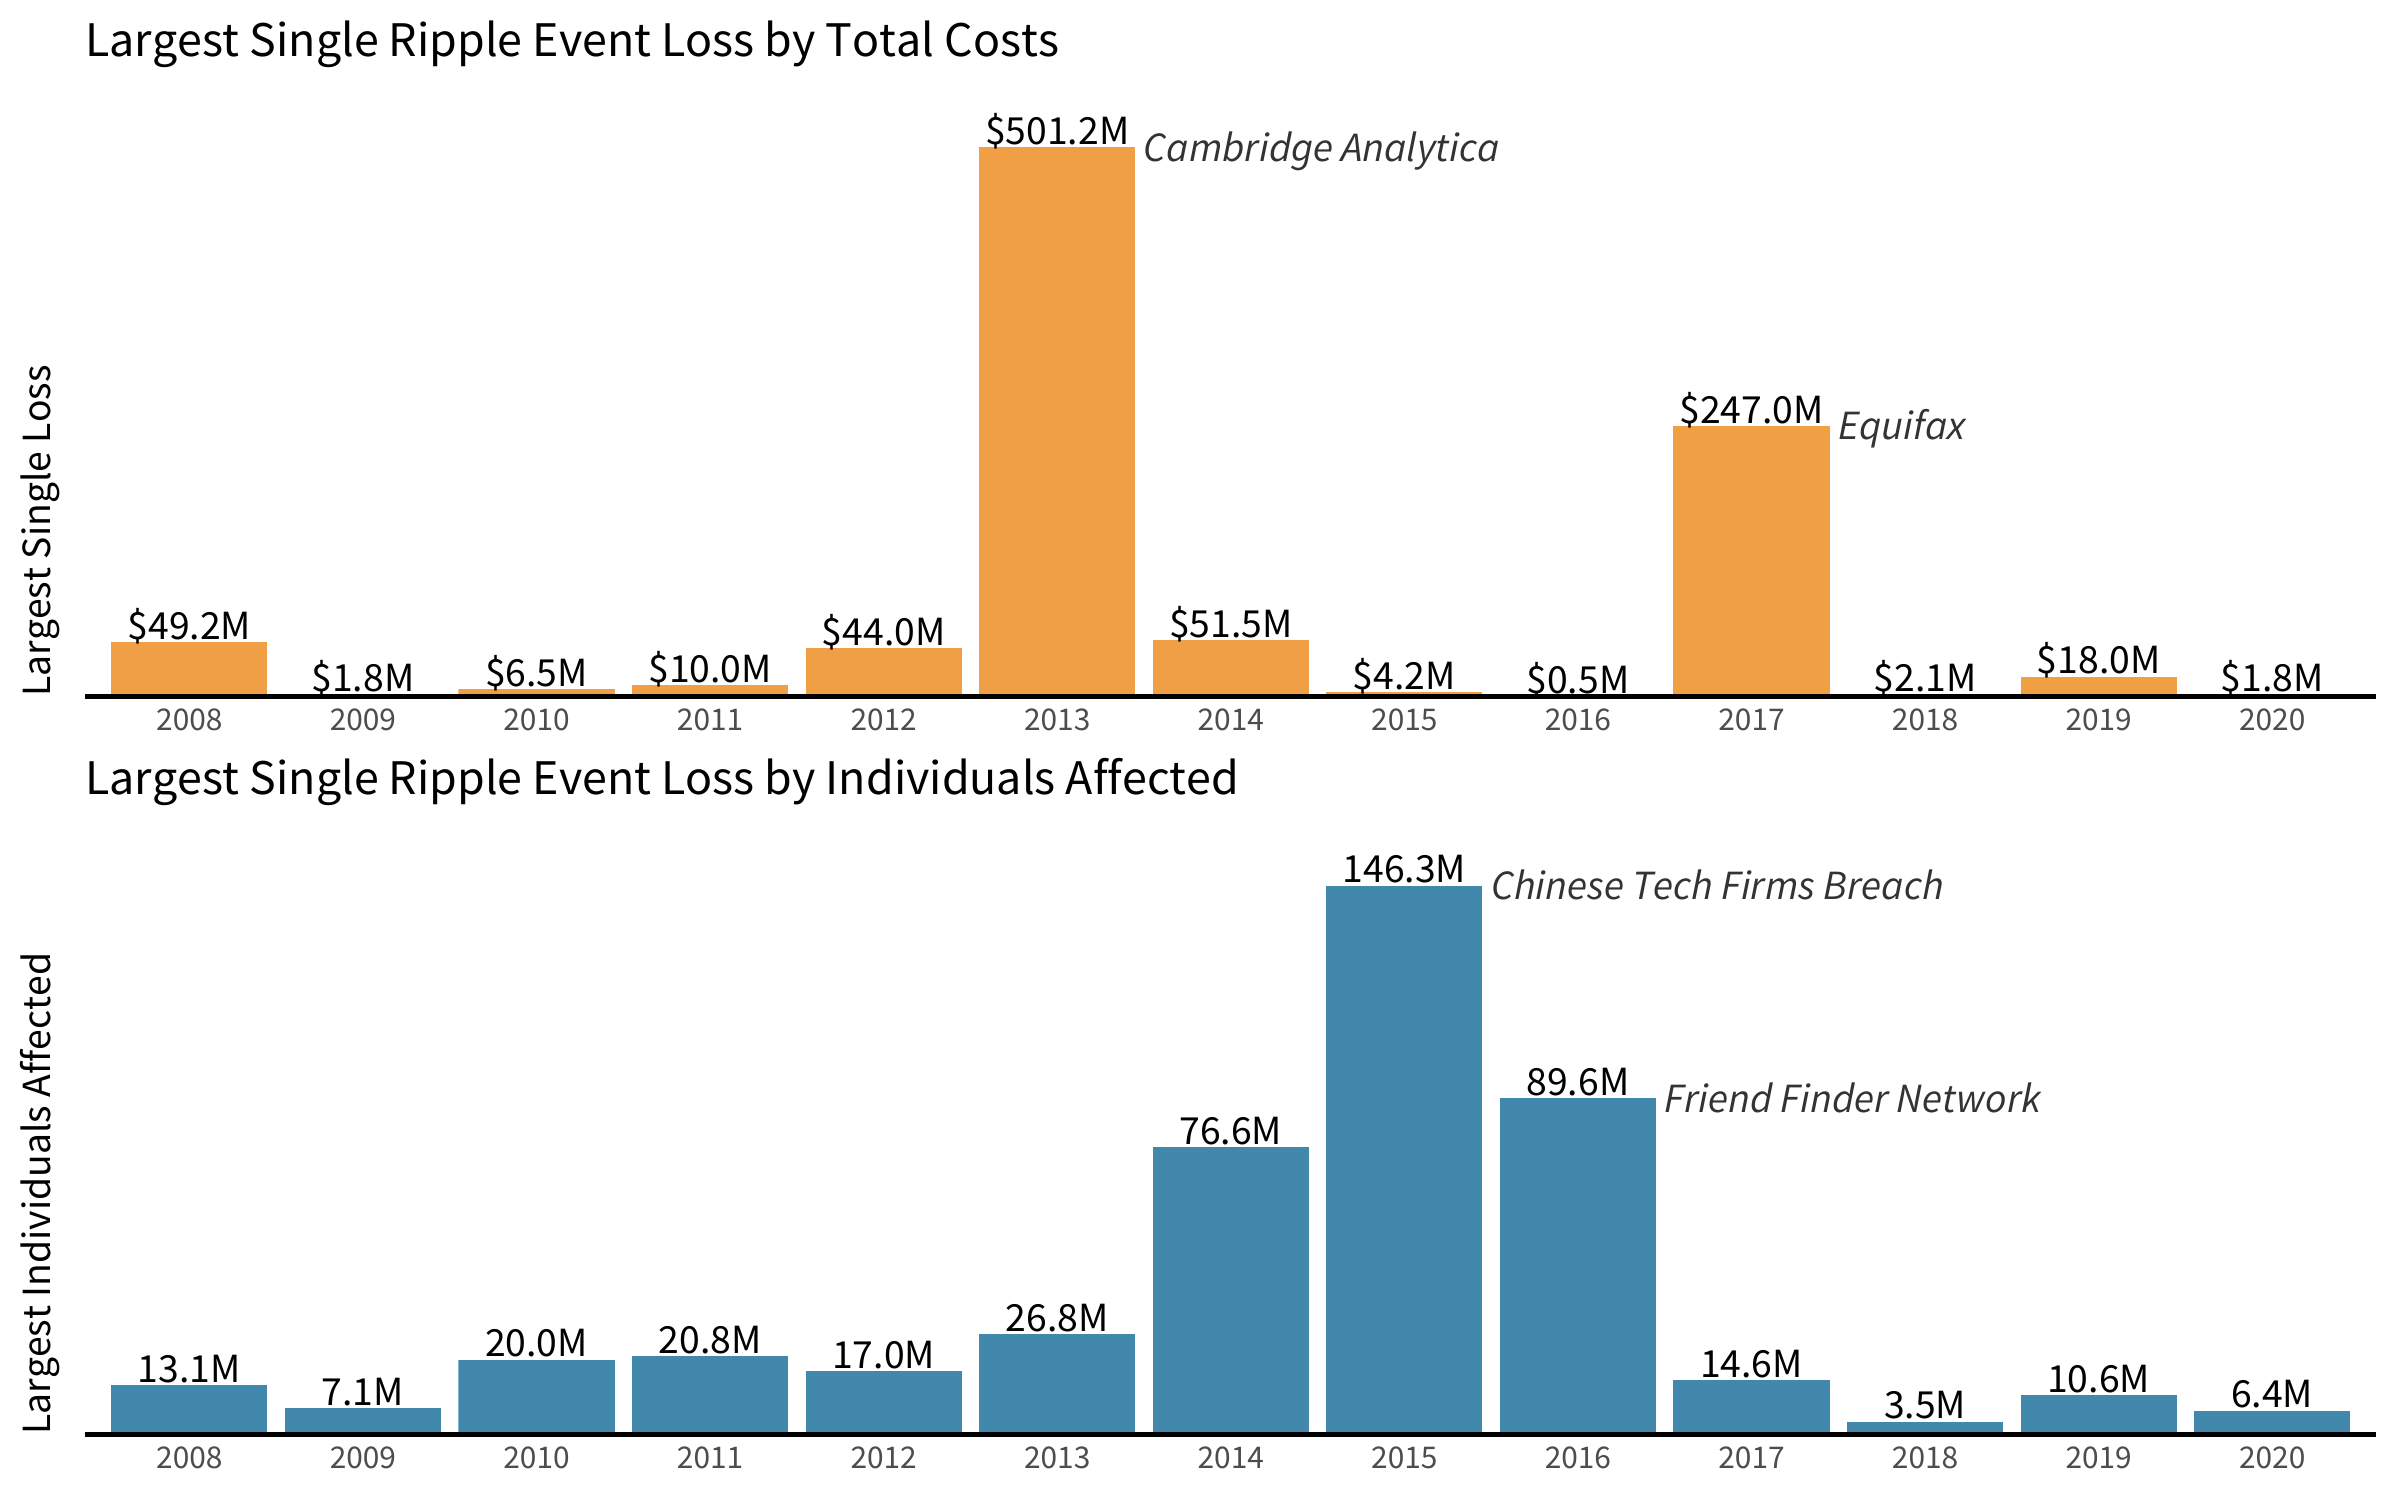
Finally, even though the total number of ripples has fallen year-over-year, the impact of the largest ripples remains huge. As we can see below, the largest ripples by total costs and total number of individuals affected can vary significantly by year, as outlier events rarely sit on a nice curve.
Figure 4: Largest Ripple Events per Year by Costs and Individuals Affected