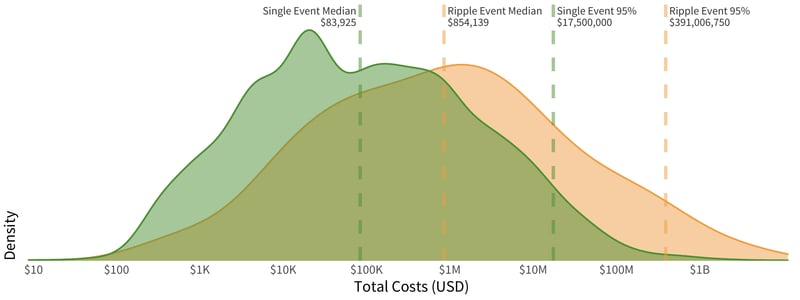
Most of the ripples we analyzed involved only four firms, but the financial impacts of all of these multi-party incidents far outweighed their traditional single-party breach event counterparts. In the below chart, we display the distribution of event density by financial costs, with ripple events in orange and single-party events in green. The placement of each curve clearly shows that ripple events have costs that far exceed single-party events.
This chart looks very similar to our 2019 Ripples Across the Risk Surface report. As new information comes to light, the median cost of single events is slightly higher than in 2019 while the median costs for ripple events are slightly lower, yet the cost of these ripple events is still nearly 10x the median cost of single party events. More troubling, when looking at the worst of these events (those single or ripple events in the 95th or greater percentile), the spread has grown larger, with ripple events now over 26x more financially damaging than the worst single-party breach events.
Cost Distributions of Ripples vs. Single Events
Digging into the kinds of losses incurred by multi-party incidents, depicted in Table 1 below, we can observe that direct damages and response costs still dominate.
Table 1: Presence and Magnitude of Different Loss Components
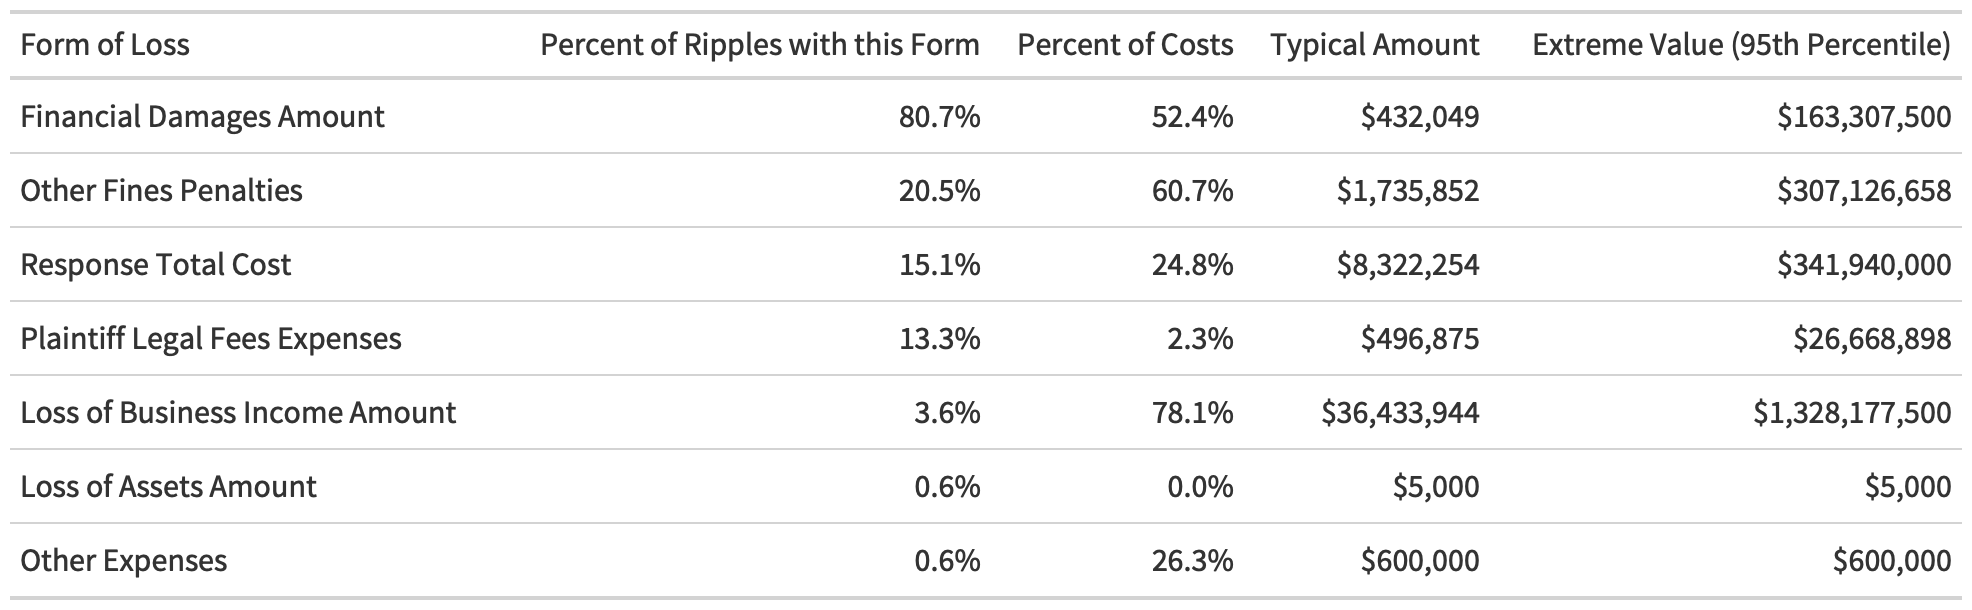
Among those ripple events for which we have cost information, 80% involve some sort of direct financial damage. One out of five of the ripples involved ends up incurring fines and penalties, and one in 10 of them incurs response costs.
While only a small fraction of ripples cause a loss of business income, such losses are particularly devastating. In those cases, the loss of income makes up 78% of costs. When a ripple event triggers a loss of income, it typically equals a staggering $36M per event.
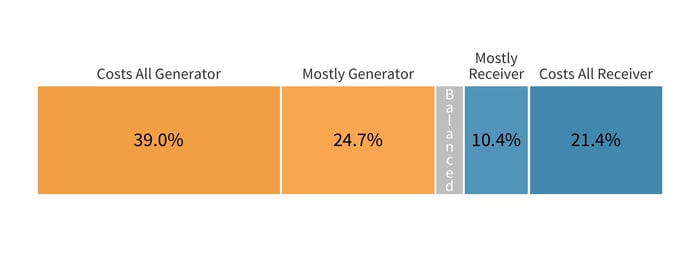
The detailed cost data available in the Advisen database only covered a fraction of our entire data set. However, there were still enough ripple events to provide statistically relevant analysis of how the costs are split between the generator and downstream victims. By parsing this subset of 154 ripples, we found that the most costs are, by far, borne by the initial victims of a multi-party breach.
This offers a strong lesson for suppliers with many customers within their data sharing or technology ecosystem. With ripple events typically costing 10x more due to the downstream impacts, organizations must keep in mind the risk they expose to their customers and partners should they trigger a multi-party incident, especially because there is a high chance they’ll be footing a much higher bill once all of the impacts shake out.
On the flip side, organizations responsible for managing the third-party risk of their vendors should keep in mind that they are never going to be immune to the financial impact of ripples. The data shows that more than one in four downstream victims end up paying most or all of the costs of a ripple incident.
Distribution of Costs Between Generator and Downstream Organizations
DURATION OF RIPPLES
If we take a look back at the yearly rolling average from the time of the triggering incident to that of the last observed activity in a ripple, we can get an idea of the duration of the impact of ripple events. Obviously, this is an imperfect measure as it is based on observed impacts rather than on how long an attacker leverages the access or data they gathered from that initial breach. Nevertheless, the image below provides valuable information about how these events tend to play out from a timeline perspective.
Time for Ripples to Propagate vs. the Initial Event
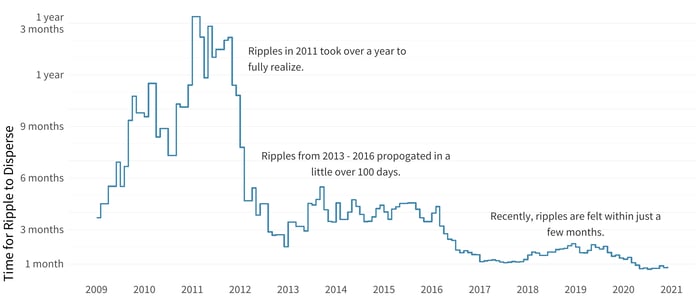
Our observation here is that the impacts are starting to be felt more quickly as time goes on—some of this is likely a result of attackers learning how to leverage the interconnection between organizations to steal more data profitably across corporate boundaries.
The time for ripples to disperse through third-party networks and beyond dropped significantly between 2012 and 2013 to less than 200 days. We saw another significant drop again in 2018 to around 50 days. There was a smaller dip in 2020, but readers shouldn’t place too much importance on that until we have a year or so to account for the lag and learn about the effects of these incidents.
Thinking about the duration of ripples differently, we sliced the data to examine the intervals of time it took for some, half, and most of the downstream recipients to feel the impact of a multi-party incident. This gives us a different view of the timelines and provides a way to find out how long it takes for firms to experience the effects of the ripples, based on the industry of the generating organization. Overall, 25% of firms are involved within 32 days after the initial event, 50% by 151 days, and 75% by just over a year at 379 days.
Disclosure Time for Generator Industry (25, 50, 75 pct)
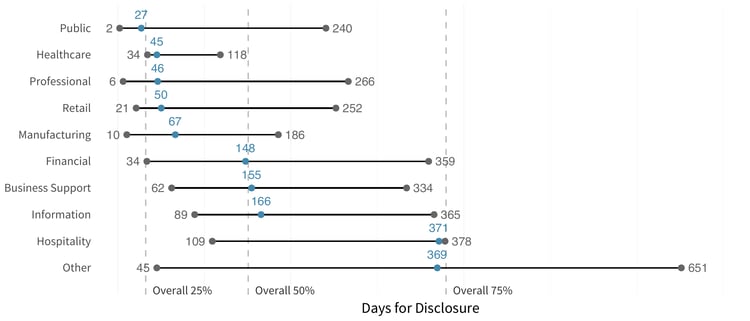
This shows that the fastest impacts rippled out from incidents within healthcare, likely due to the strong reporting requirements in that space. Meantime, the hospitality and information industries take approximately a year before most downstream victims fully feel a ripple.
WHAT’S MAKING WAVES: CATEGORIZING RIPPLE EVENTS
In our inaugural edition of this ripples analysis, we didn’t dig nearly enough into the data on what exactly has been causing these ripples. Distinguishing a root cause from all of the other activities in a ripple is a challenge, but we thought we’d at least try to examine high-level event categories this year and enumerate the types of ripples occurring across the entire data set.
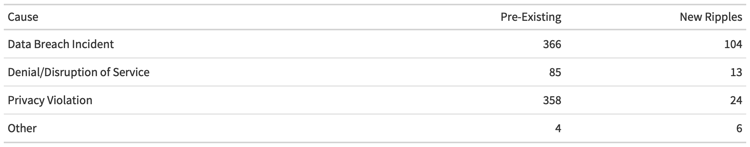
The table above breaks up ripple incidents into three main categories: traditional data breaches, denial of service or disruption of service events (DoS), and privacy violations. The latter tends to comprise the exposures of cloud data stores and cloud misconfiguration that have been especially coming into light over the last four or five years.
The data shows that data breaches remain the dominant generating event for ripples, with privacy violations coming in a close second. DoS events are far less common than ripple events, although that doesn’t necessarily mean they aren’t a source of concern. As we mentioned earlier, loss of revenue can be extremely significant in multi-party incidents, and this can be a common side effect of the high-level DoS category.