Having taken a few different readings about the size and scope of these digital tsunamis, our next question is what causes them. There are several ways we can examine that. We’ll start by dividing up events into high-level categories, then grouping them according to common incident patterns, and end with listing the most prevalent contributing threat actions.
Loss event category
It is common at the executive and board levels to slot cyber events in high-level categories that resemble those in the figure below. These categories focus more on how the organization is affected rather than how the incident occurred. Some events exhibited both disruption and disclosure aspects, but we chose the category that best describes the primary nature of the incident.

FIGURE 1: DISCLOSURES VS. DISRUPTIONS AMONG EXTREME MULTI-PARTY CYBER INCIDENTS
It is clear that most massive multi-party cyber incidents (41/50) fall in the data disclosure bucket. Also, it is apparent that these disclosure events are responsible for the majority of all downstream victim organizations (72%) identified in this study. Most secondary impacts were to either owners of the data compromised at a central victim organization or those experiencing losses from related fraudulent activity.
But those facts should, by no means, cause you to dismiss disruptive events. They racked up more total losses (almost $10 billion!), larger per-event costs, and a higher median number of affected parties. Thus, one could argue that, when they do occur, business disruptions tend to cause bigger ripples across business relationships than data disclosures.
Incident patterns
Beyond the broad categories of disclosures and disruptions, we’ll now group incidents according to basic patterns that we’ve seen used in cyber risk management programs. These patterns are based on common actors, actions, technical impacts, etc. that collectively describe a general scenario. These incident patterns are described below, and an analysis of their frequency and impact follows suit.
- DDoS attack: Any attack intended to render online systems, applications, or networks unavailable, typically by consuming processing or bandwidth resources.
- Exposed data: Data stores that are inadvertently left accessible to unauthorized parties, typically through misconfigurations on the part of the data custodian.
- Scam or fraud: Incidents that primarily employ various forms of deception to defraud the victim of money, property, identity, information, etc.
- System intrusion: All attempts to compromise systems, applications, or networks by subverting logical access controls, elevating privileges, deploying malware, etc.
- Insider misuse: Inappropriate use of privileged access, either by an organization’s own employees and contractors, or a trusted third party.
- Physical threat: Threats that occur via a physical vector, such as device tampering, snooping, theft, loss, sabotage, assault.
- Ransomware or wiper: The broad family of malware which seeks to encrypt data with the promise to unlock upon payment or seeks to completely eradicate data/systems without the pretense of collecting payment.
- System failure: All unintentional service disruptions resulting from system, application, or network malfunctions or environmental hazards.
Similar to when we studied extreme cyber events, system intrusions were by far the most common pattern (31/50 events). These incidents also impacted the largest number (57%) of downstream organizations and accounted for nearly a quarter of all financial losses. Again, we view this as a reflection of highly integrated B2B relationships.
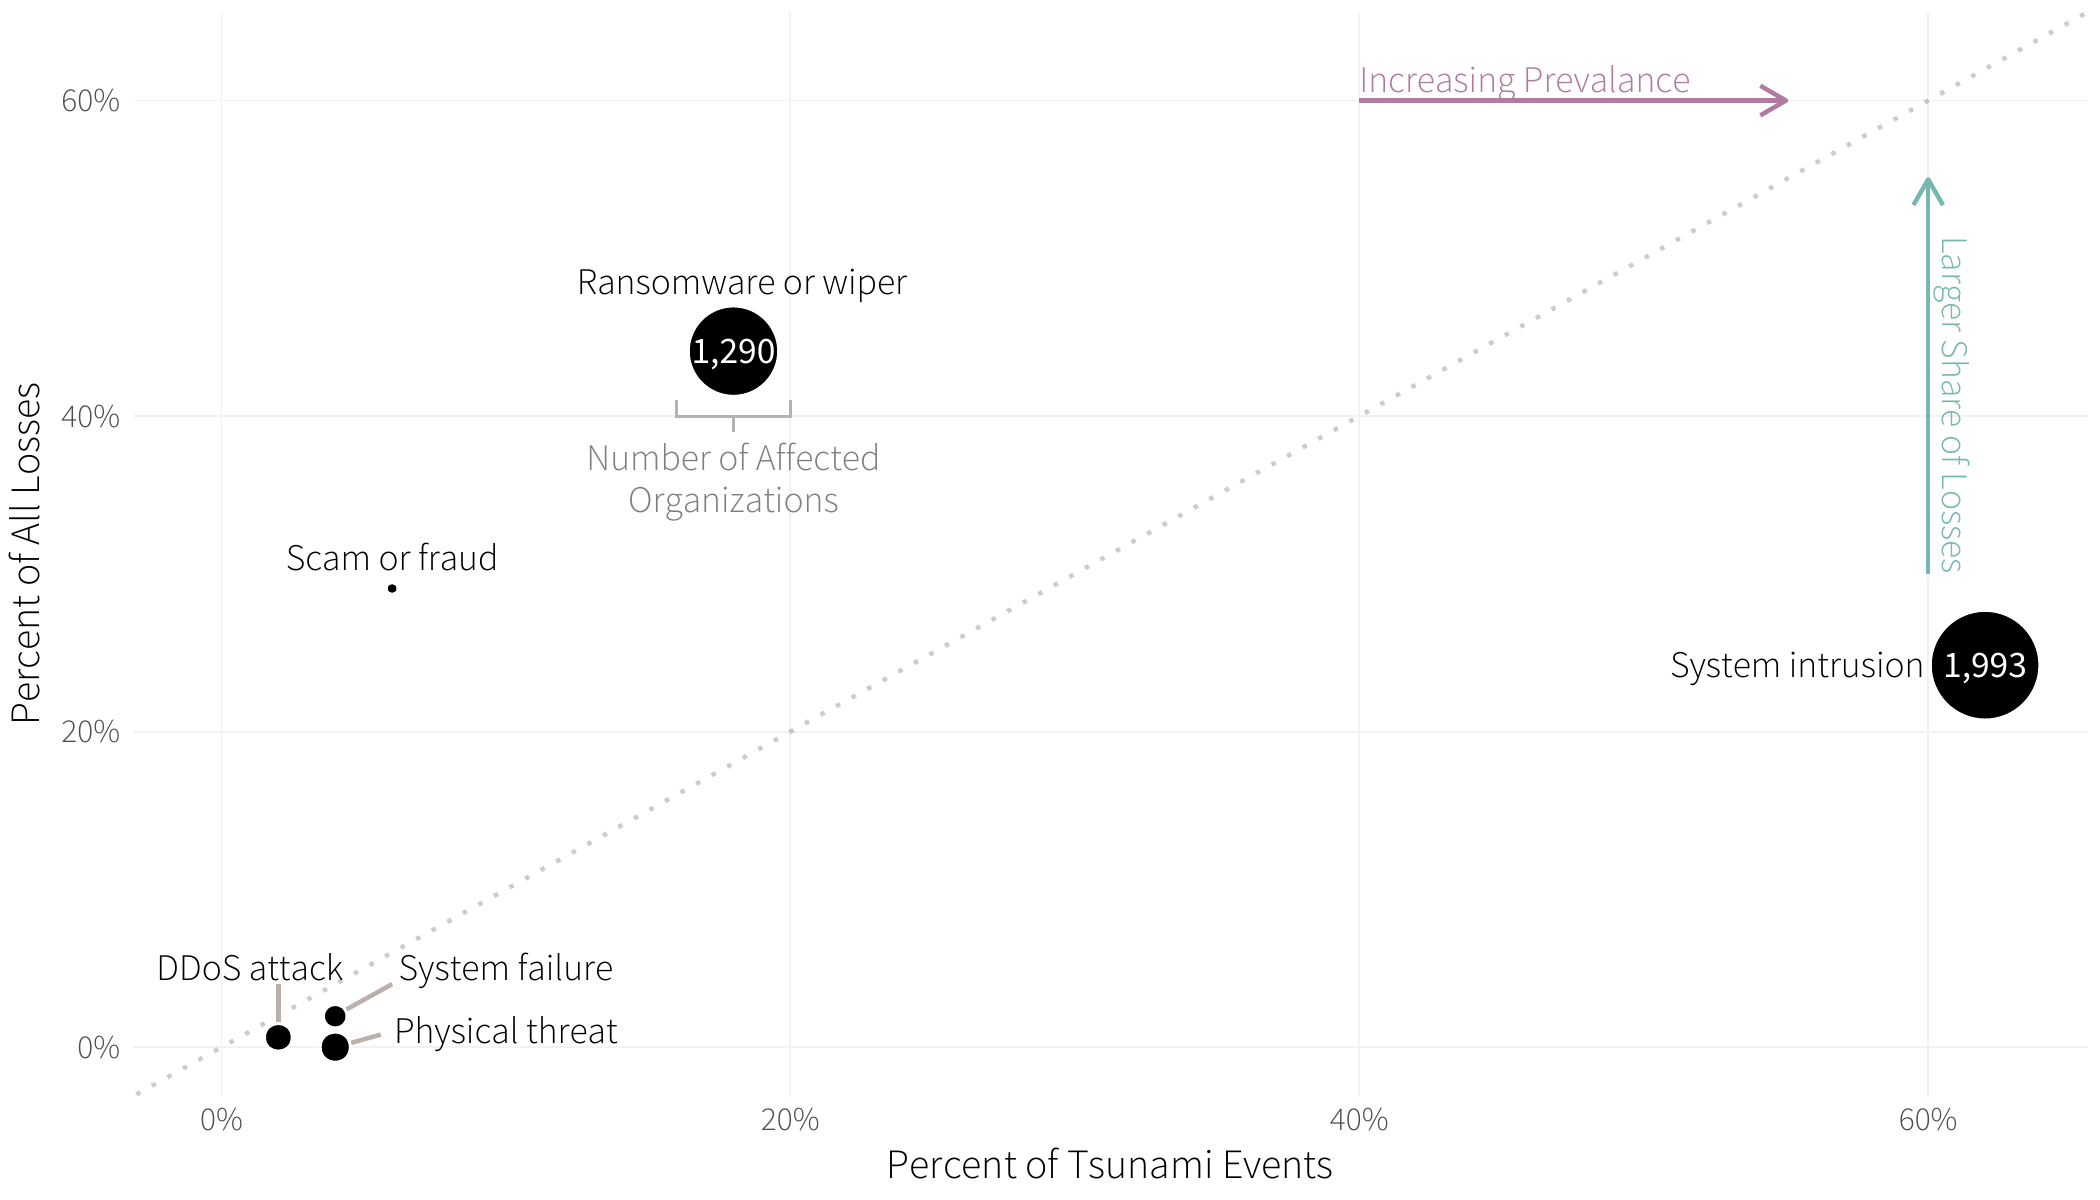
FIGURE 2: BASIC INCIDENT PATTERNS AMONG EXTREME MULTI-PARTY CYBER INCIDENTS
Ransomware lags as a distant second in terms of frequency but sprints to the top of the charts for total losses. It is responsible for an impressive 44% of recorded losses across all incidents. Add the 37% of secondary victims to that rap sheet, and it is apparent that ransomware is a heavyweight among major multi-party cyber loss events.
With one exception, the other patterns in Figure 6 come in ones and twos, not causing huge direct or collateral damage. The exception, of course, is fraud or scams with a big price tag of over $5 billion. But nearly that entire amount comes from an unusually hefty fine associated with just one incident—the Facebook / Cambridge Analytica scandal.
Initial Access Techniques
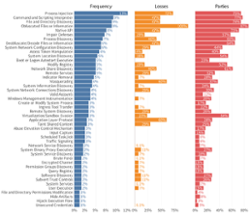
Now, we’re shifting from the question of “what?” (categories and patterns) to a question of arguably more practical importance: “how?” We’ll begin by reviewing the techniques for gaining initial access to target environments as defined in MITRE’s ATTACK framework.3 Keep in mind that we’re only looking at the initial vector into the first (central) victim organization here, which is why supply chain compromise is zeroed out. But don’t despair—a more complete listing of all observed threat actions and the methods of propagation to downstream parties is coming right up.
It seems that abuse of valid accounts tops every single incident dataset that we examine, and this one is no exception. Guessed, cracked, stolen, or otherwise compromised (note phishing at number 5), credentials offer adversaries not only an entry vector but elevated privileges and a cloak of legitimacy to boot. It is really no surprise that this technique was more common and more costly than any other means of initiating a successful attack.
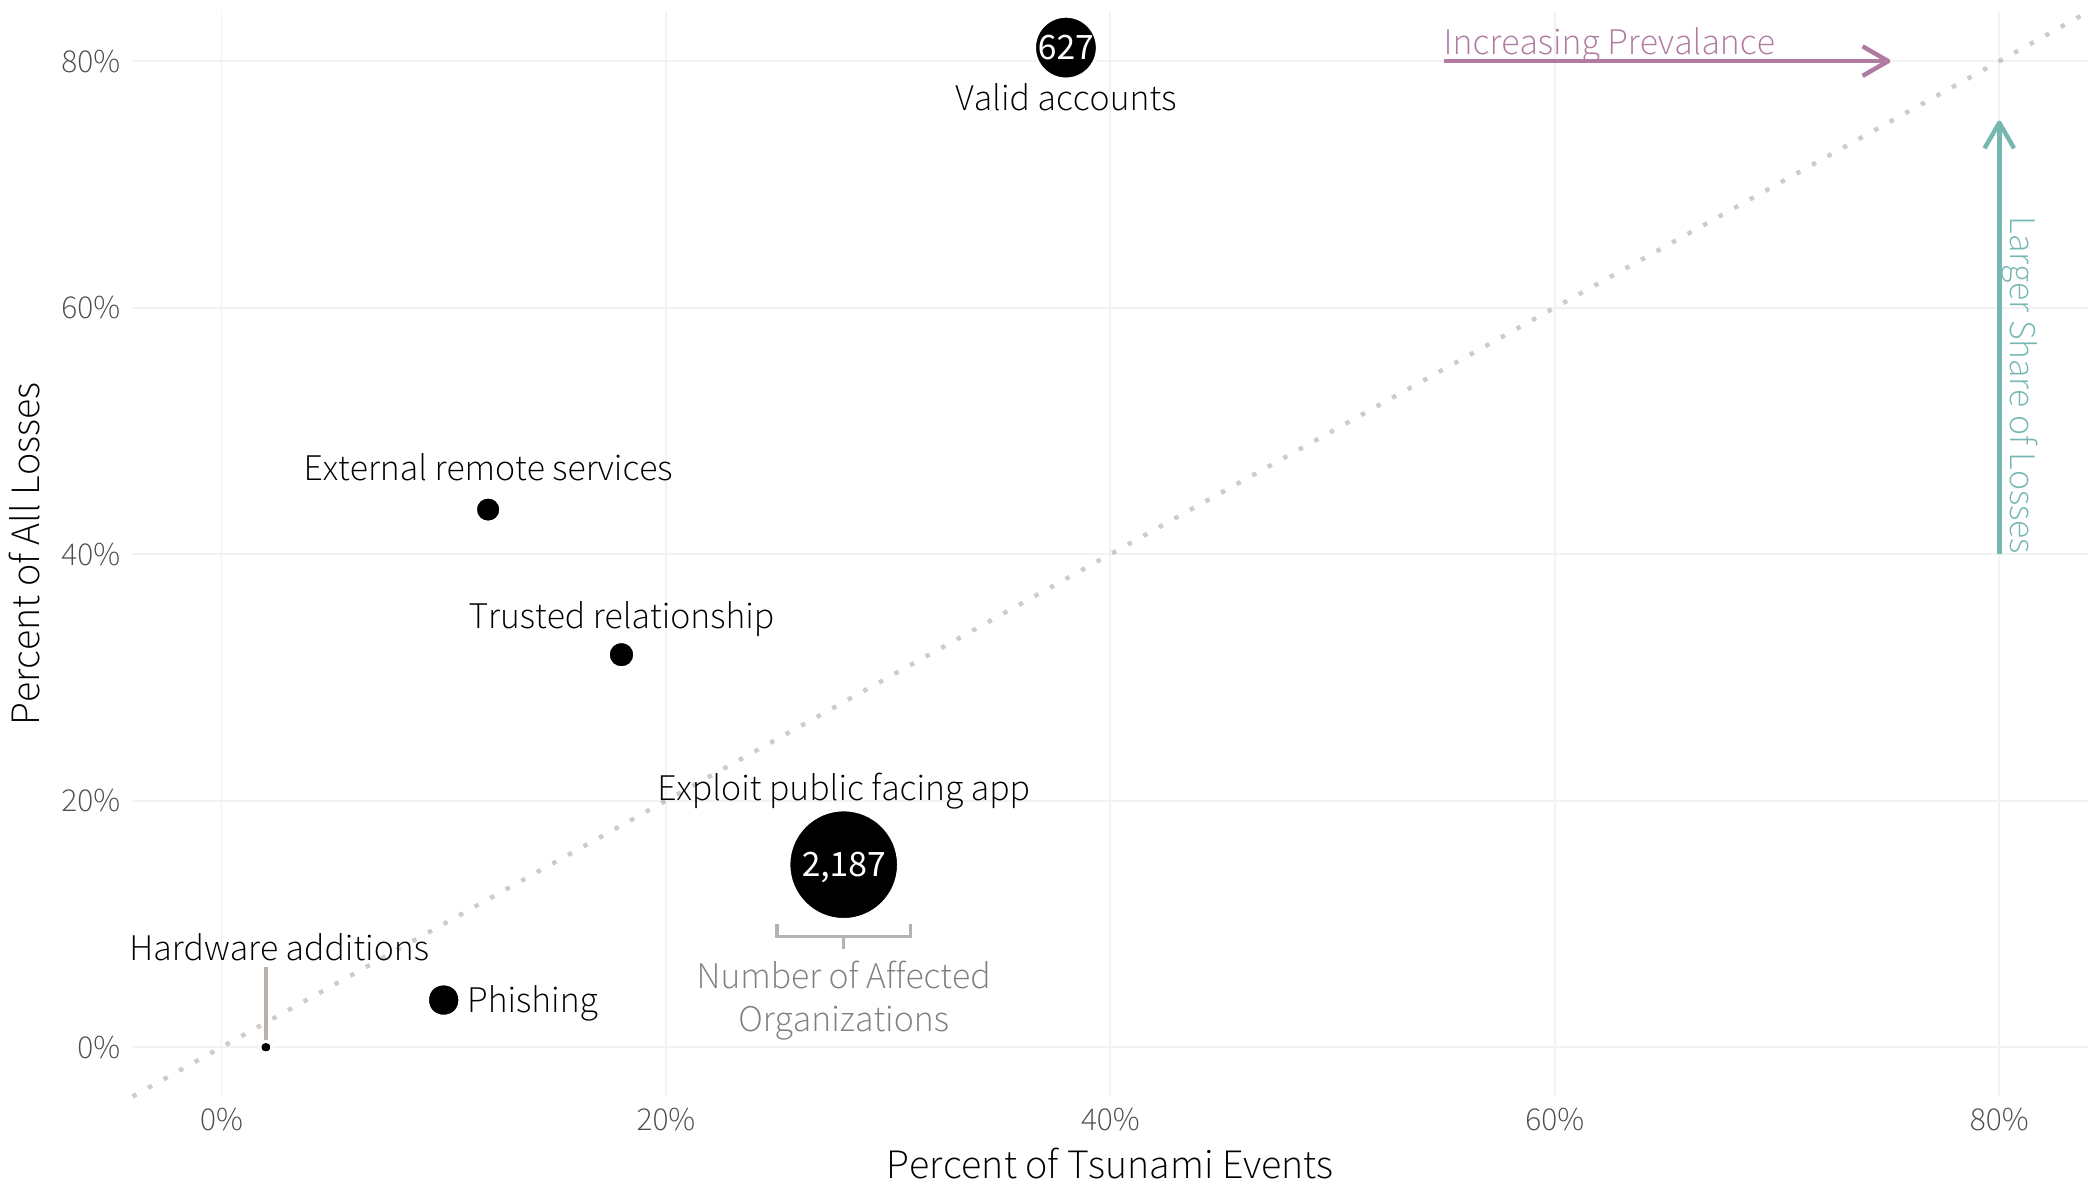
FIGURE 3: ATTACK INITIAL ACCESS TECHNIQUES IN EXTREME MULTI-PARTY CYBER INCIDENTS
While on the topic of subverting valid accounts, let’s briefly touch on the exploitation of trusted relationships. Similar to the abuse of valid accounts, the notion of trust is central to this technique. Why bother stealing credentials if you already have access? And for many organizations these days, the list of third parties capable of misusing that access is long.
Circling back to the second-most frequent technique, we’re reminded once again of how much threat actors love exploiting public-facing applications. This technique also led to more collateral victim organizations (63%) than any other. In the words of whoever’s talking to Becky in Baby Got Back, they’re “just so big” and “like out there.” And all too many of them are riddled with unpatched vulnerabilities that make them the proverbial low-hanging fruit.
We’ll end with a couple of comments on external remote services because though not extremely prevalent, this technique led to surprisingly high financial losses. Again, we can’t help but see the trust theme here because such services are deployed to support legitimate access. Figure 7 attests to what can happen when those services fall into the wrong hands.
All observed threat actions
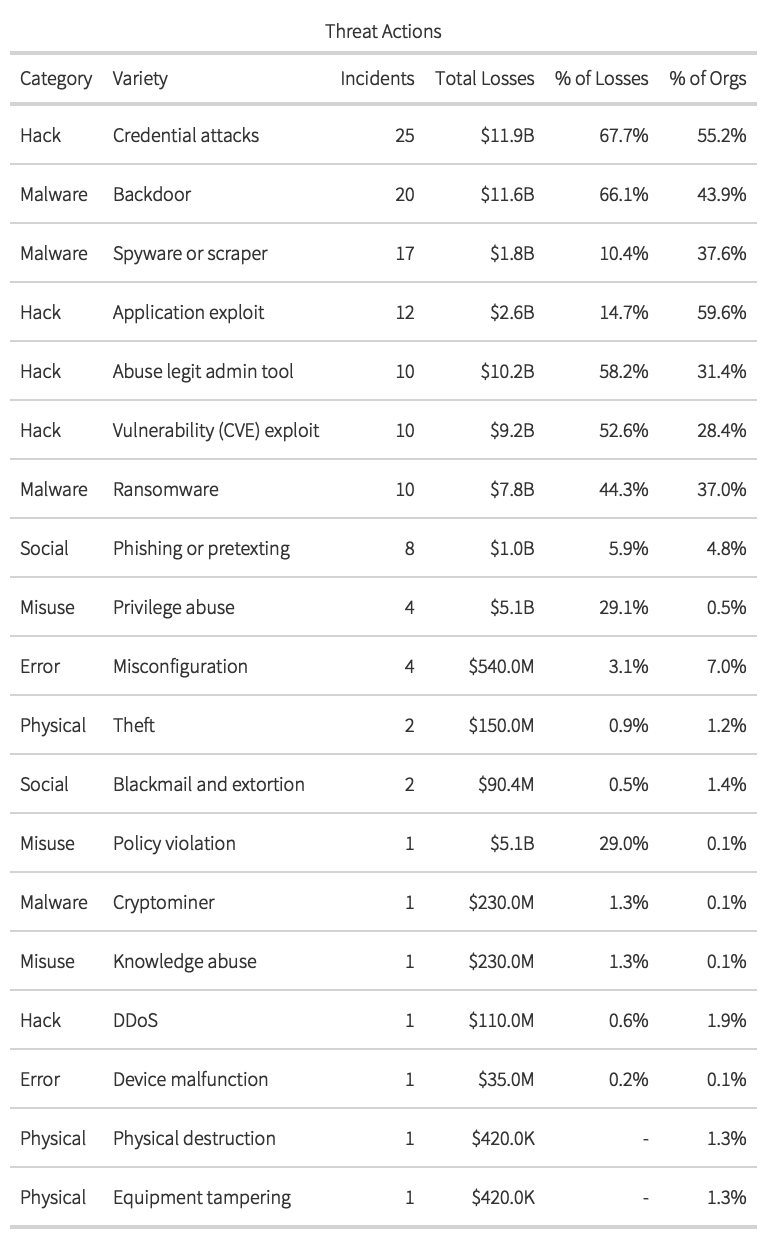
This section offers a broader view of every identifiable threat action4 that is taken by actors across all phases of all incidents. The word identifiable is a key caveat here because this, as with everything else in this report, is based on what we could ascertain from publicly available information. An incident response team combing through the forensic evidence would undoubtedly be able to record it in more detail. That said, there are solid takeaways from Table 1, and we’ll highlight just a few.
In case you’re wondering, yes, credential attacks in Table 1 are pretty much synonymous with valid accounts from Figure 7. And call it what you will, compromising legit credentials once again reigns supreme as the leading contributor to both frequency and losses among this cohort of large multi-party incidents. The numbers don’t line up because Table 1 includes events where credential attacks were used after initial access (e.g., for lateral movement). But seriously, don’t fixate on those pedantries; just focus on rolling out multi-factor authentication across your enterprise and third-party accounts.
If criminals can’t get in through the front door by stealing credentials, Table 1 suggests that they’ll probably attempt to gain entry via a backdoor. Remote access malware contributed to the second-highest totals for event frequency (20) and losses ($11.6 billion). And it looks like there’s a good chance they’ll toss in malware that captures data (spyware, scrapers) while they’re at it.
Since application exploits and abuse of legit admin tools (external remote services in ATT&CK lingo) have already been discussed, we’ll skip over those. But the high costs associated with vulnerability exploits deserve a special mention...even though the importance of patching is cybersecurity 101. We know that it’s impossible to patch all the things, but our research has proven that it is possible to patch the things most likely to lead to incidents such as those in this report.
There’s a lot of additional commentaries we could add from the table below, but this blog is long enough as is. Plus, you’re a professional who’s fully capable of picking out what’s most useful for your unique needs and interests. We’ll leave you to it—good luck!